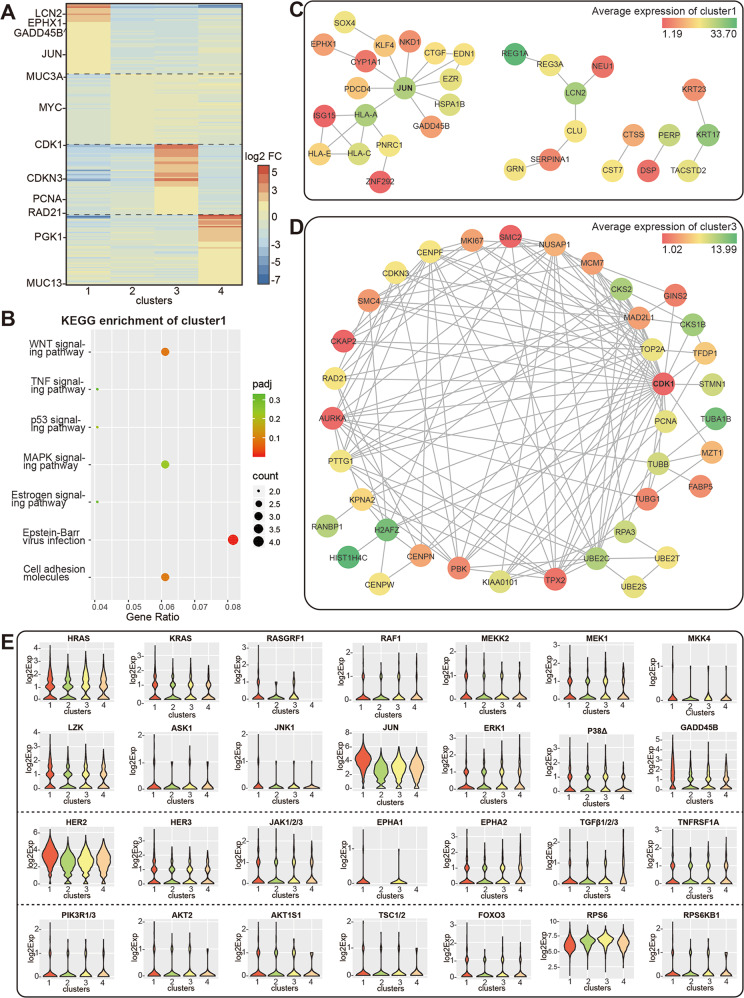
Fig. 3. Intratumoral heterogeneity and differential cell phenotypes in 176P and 176R tissues.
A Heatmap showed the top 50 upregulated genes in each cluster. The color bar represented the value of log2 fold change. B The top 50 genes of cluster 1 were enriched by KEGG database. C, D Network diagrams of the top 50 genes of cluster 1 (confidence Score = 0.400) and cluster 3 (confidence score = 0.900) according to STRING database. The color bar represented the average expression of genes in each cluster. E Violin plots showed the expression profile of some critical molecules that were involved in membrane receptor tyrosine kinase, MAPK, PI3K/AKT signaling pathways in four clusters.

