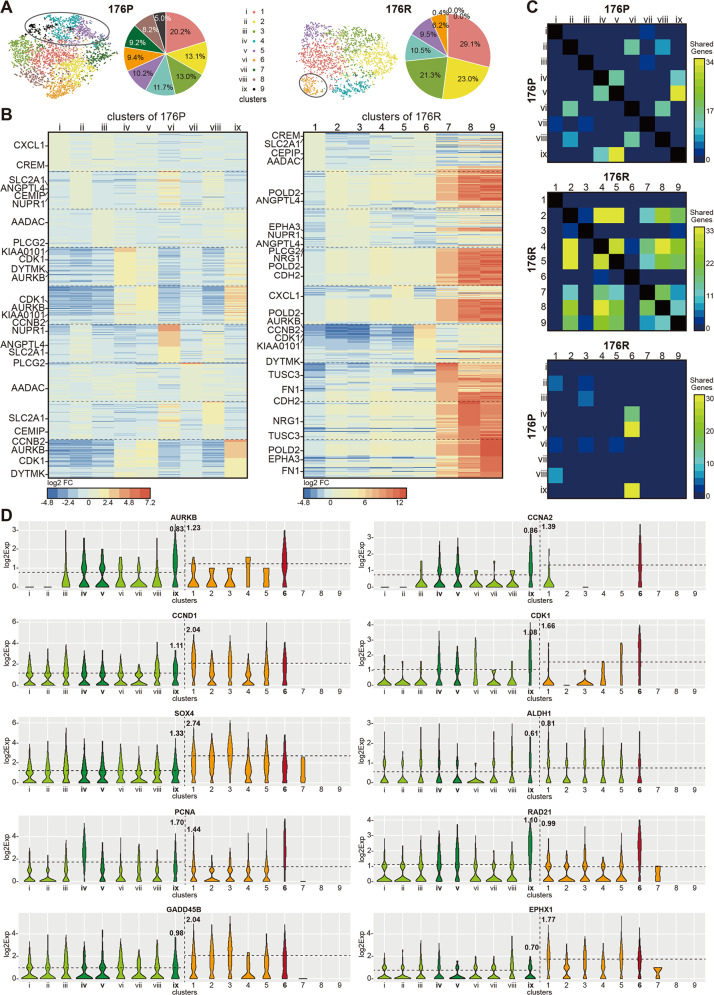
Fig. 4. Homology analysis revealed the evolved process from parental tissue to Trastuzumab resistant tissue.
A 4311 cells of 176P and 2936 cells of 176R were divided into nine clusters by k-means algorithm, respectively. B Heatmaps showed the top 50 upregulated genes in each cluster compared to other eight clusters of 176P and 176R tissues. C Shared genes between clusters in the same samples or between clusters in different samples. D Some differentially expressed shared genes in different clusters of 176P and 176R tissues. Cluster 6 and cluster ix, v, iv were highlighted. Dashed lines represented log2 average expression of cells in both samples.

