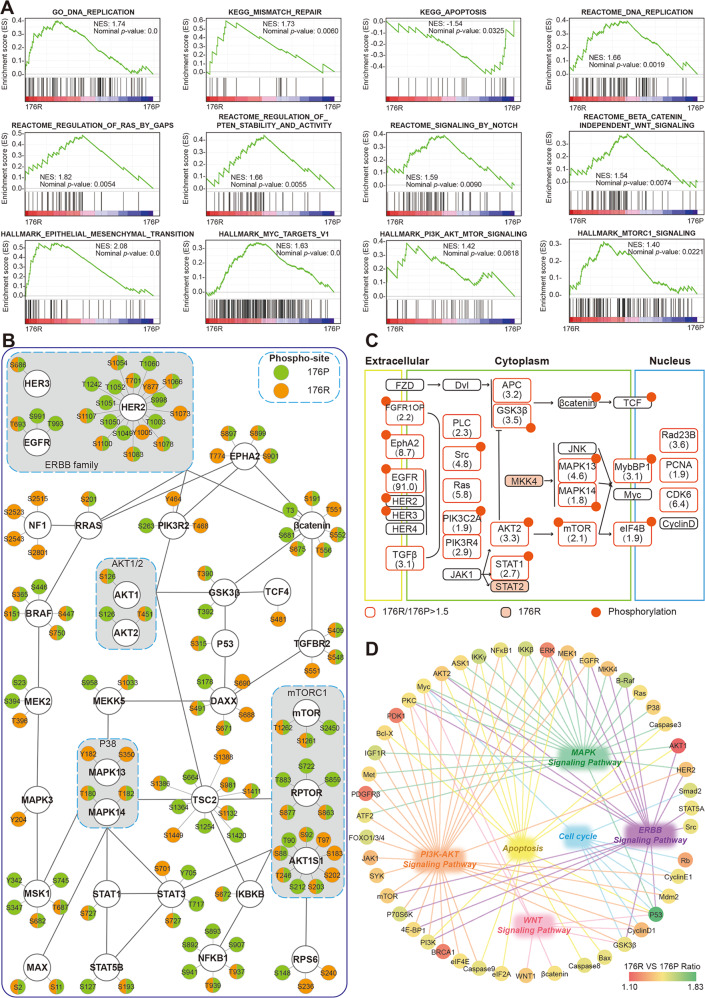
Fig. 5. Protein expression profile and phosphorylation profile in tissues before and after Trastuzumab resistance.
A The total 2983 proteins expressed both in 176P and 176R tissues were enriched according to GO, KEGG, REACTOME, and HALLMARK datasets, by GSEA. NES: Normalized Enrichment Score. B Phosphorylation profiles of some important molecules identified by protein chip. C The upregulated and phosphorylated proteins were distributed in various signaling pathways after Trastuzumab resistance by proteomic analysis. D The upregulated proteins found by protein chip were involved in several critical pathways including MAPK, PI3K/AKT, WNT pathways, and so on.

