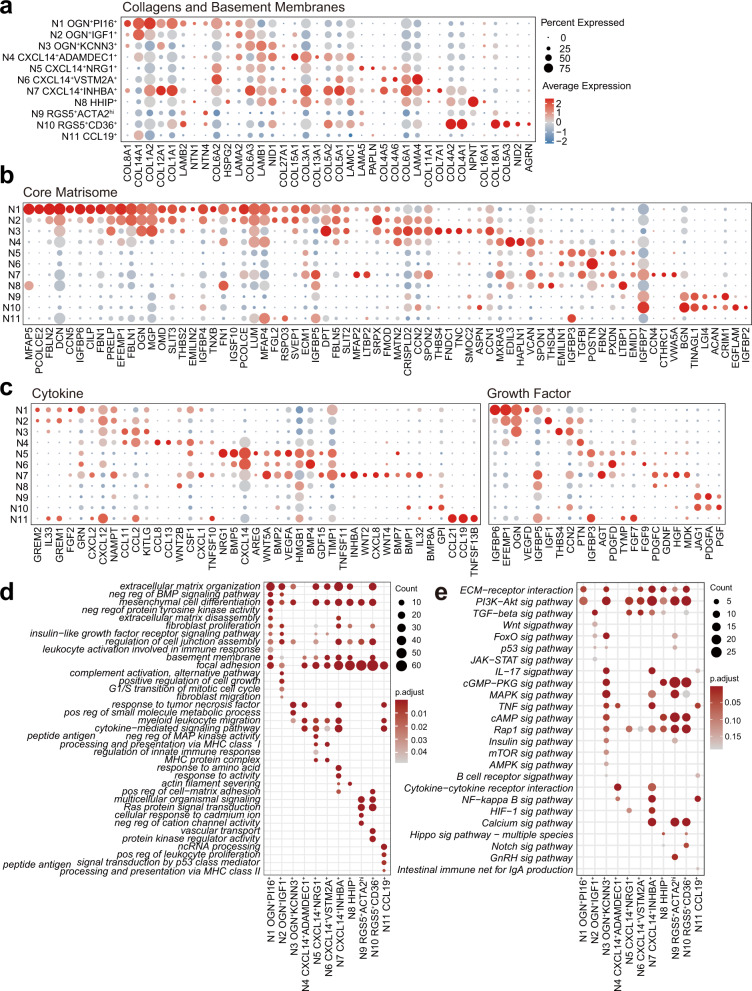
Fig. 2. The patterns of gene expression profiles in human colonic mucosa fibroblasts and myofibroblasts.
a–c Dot plot showing the scaled expression of several key biological function-related gene sets of each cluster in mucosa. Gene sets were downloaded from the Molecular Signatures Database (MSigDB). The color gradient represents the average expression of each gene in each cluster scaled across all clusters. The dot size represents the percentage of positive cells in each cluster. The colors representing each cluster in the color band correspond to those in Fig. 1a. a Genes encoding structural components of basement membranes (M5887) and collagen proteins (M3005). b Genes encoding core extracellular matrix components, including ECM glycoproteins, collagens and proteoglycans (M5884), excluding the genes contained in Fig. 4A. c Genes encoding cytokines (GO:0005125) and growth factors (GO:0008083). d Gene Ontology analysis of marker genes for each cluster. e KEGG enrichment analysis of marker genes for each cluster.

