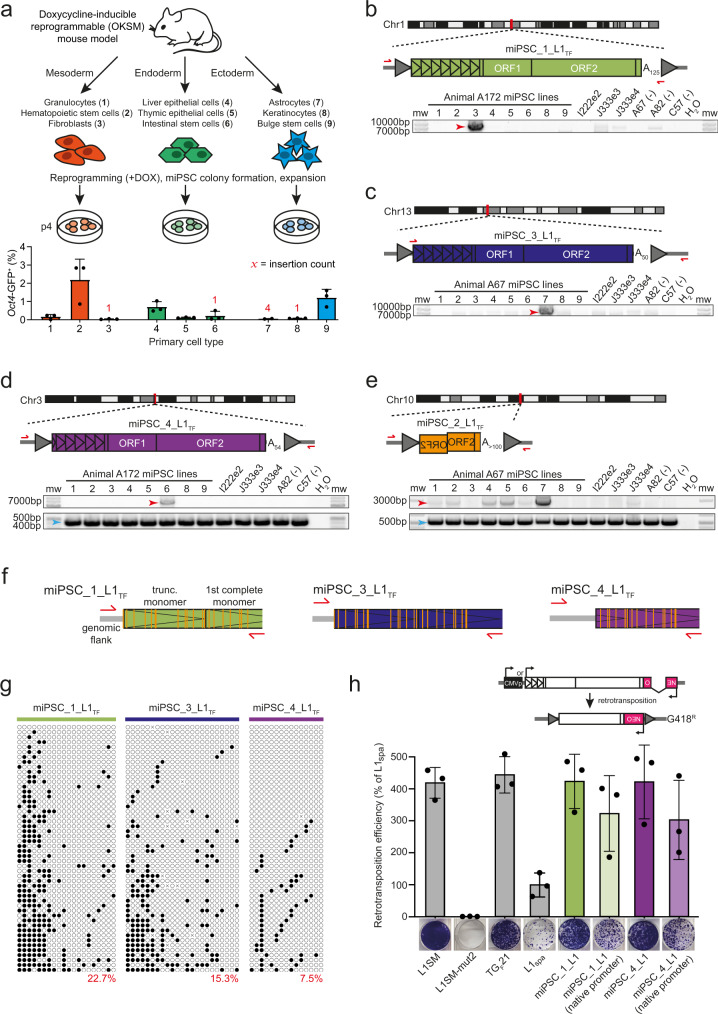
Fig. 1. De novo L1 insertions in germ layer specific bulk expanded miPSC lines.
a Experimental design of bulk miPSC generation using a Col1a1-tetO-OKSM mouse model containing a doxycycline-inducible reprogramming cassette. Tissues were isolated and sorted by FACS to obtain 9 primary cell types (named and numbered 1–9) from each of 3 mice (A67, A82, A172). After reprogramming with doxycycline (+DOX), Oct4-GFP positive miPSCs were sorted and expanded in cell culture. DNA was extracted from miPSCs, sequenced via WGS and mRC-seq, and analyzed for de novo TE insertions with TEBreak. The histogram displayed underneath indicates the mean reprogramming efficiency (Oct4-GFP+) ± SD for each primary cell type, with individual replicate values marked by black dots. Red numerals indicate the count of reprogramming-associated L1 insertions found in the miPSCs obtained from each primary cell type. Note: astrocyte-derived miPSCs were not produced for animal A172. b A full-length (6.8 monomers) intergenic de novo L1 TF insertion. Promoter monomers are shown as triangles within the L1 5′UTR. PolyA (An) tract length is indicated immediately 3′ of the L1. Target site duplications (TSDs) are depicted as gray arrows flanking the L1. PCR validation primers are shown as red arrows. A PCR validation agarose gel containing the full-length PCR product (red arrow) only in the fibroblast-derived miPSC line where the L1 was detected by genomic analysis is shown. miPSC line numbers are provided in (a). Molecular weight (mw) markers are provided at the left of the gel. Note: given the variable, and in some cases very low, reprogramming efficiencies shown in (a), and the objective to obtain a full set of 9 miPSC lines from each animal, we entirely used each sorted primary cell population for reprogramming, relying on PCR amplification in a single miPSC line to validate reprogramming-associated retrotransposition events. DNA from other animals included in the study are however shown at right as additional controls. c As for (b), except for an L1 TF with 5.8 promoter monomers. Note: the very faint, smaller-sized gel band observed in most of the samples was an off-target product. d As for panel (b), except for an L1 TF with 5.3 promoter monomers, and using an empty/filled PCR design where both primers are outside of the L1 insertion, generating filled L1 (red arrow) and empty wild-type (blue arrow) products. e As for panel (b), except showing a 5′ truncated and inverted/deleted L1 TF insertion and using an empty/filled PCR validation design, as per (d). f Locus-specific methylation analysis schematic representation for 3 full-length de novo L1 insertions (panels b–d). After bisulfite conversion, the 5′ monomeric sequences of each L1 were PCR amplified using primer pairs (red arrows) specific to that locus. Amplicons were then pooled and sequenced as 2×300mer Illumina reads. Orange strokes indicate CpG dinucleotides covered by the assay. g Methylation of the 3 L1 promoter sequences shown in panel (f), in the miPSC line where each de novo L1 insertion was identified. Each cartoon panel corresponds to an amplicon and displays 50 non-identical sequences (black circle, methylated CpG; white circle, unmethylated CpG; ×, mutated CpG) extracted at random from a much larger pool of available Illumina reads. The percentage of methylated CpG is indicated in the lower right corner of each cartoon in red. h Top: Rationale of a cultured cell retrotransposition assay19, 67. A mouse L1 driven by its native promoter alone, or with the addition of a CMV promoter (CMVp), is tagged with an antisense orientated neomycin (NEO) reporter cassette interrupted by an intron. Cells harboring this construct become neomycin (G418) resistant upon retrotransposition. bottom: Retrotransposition assays conducted in HeLa cells. Constructs included: L1SM68, a highly mobile synthetic L1 (positive control); L1SMmut2, L1SM with endonuclease and reverse transcriptase active site mutations (negative control); TGF21, a mobile L1 GF element;21 L1spa, a mobile L1 TF element;22 miPSC_1_L1 (panel b); miPSC_4_L1 (d). Data were normalized to L1spa and are shown as mean ± SD of three independent biological replicates (black dots, n = 3), each of which comprised three technical replicates. Representative well pictures are shown below each construct. Note: L1SM retrotransposed very efficiently, leading to cell colony crowding in wells, and a likely underestimate of retrotransposition. Unless otherwise stated, L1 constructs incorporated a CMVp element. Source data are provided as a Source Data file.

