Figure 2.
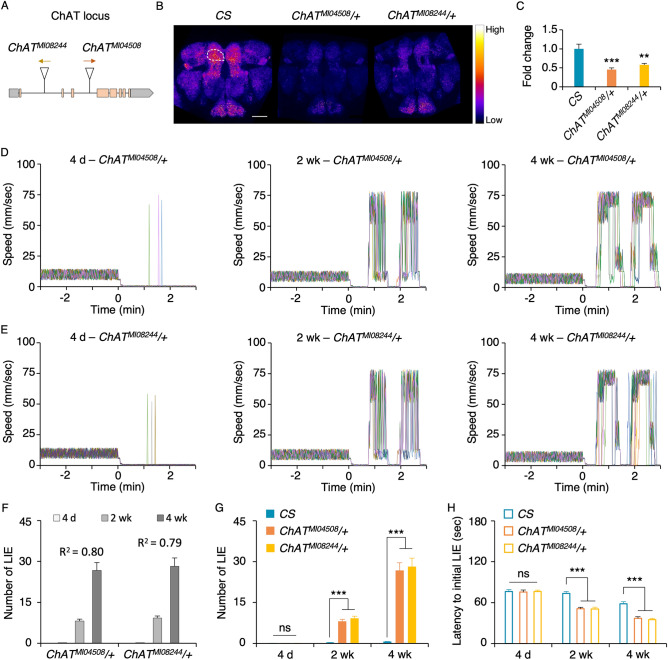
ChAT deficit amplifies the impaired inhibitory control with aging. (A) The scheme depicts the locations of the transposon MiMIC insertions in the ChAT locus: ChATMI04508 (the orange arrow denoting direction of the splice acceptor in the transposon) and ChATMI08244 (yellow arrow denoting direction of the splice acceptor). The coding regions are noted in orange boxes, noncoding regions in gray boxes, and introns in gray lines (not to scale). (B)ChAT immunoreactivity in the brains of CS, ChATMI04508/+ and ChATMI08244/+ . Signal intensity is converted into a fire scale. Quantification of ChAT immunoreactivity was done in the superior medial protocerebrum (SMP) in both hemispheres, one of which is demarcated with a white circle. Both heterozygous ChAT mutants had less ChAT immunoreactivity compared to CS. Scale bar, 50 μm. (C) Quantified ChAT immunoreactivity comparison. ChAT immunoreactivity levels were normalized with the average ChAT immunoreactivity level of CS. The heterozygous ChAT mutants showed significantly reduced ChAT immunoreactivity in the SMP compared to CS (ANOVA with post hoc Dunnett test using CS as a control: **, p = 0.0006; ***, p < 0.0001; n = 8–11). (D,E) Each graph depicts the representative movement traces of 13 flies in a chamber: ChATMI04508/+ (D) and ChATMI08244/+ (E) across different ages (4 day, 2 week, and 4 week). (F,G) Comparison of the number of LIEs per fly per min for ChATMI04508/+ , ChATMI08244/+ and CS at three different ages. The older heterozygous ChAT mutants exhibited higher LIEs (F: ANOVA R2 values are noted in the graph; n = 12), which are significantly more than those of CS at the ages of 2 week and 4 week but not at the age of 4 day (G: ANOVA with post hoc Dunnett test using CS as a control: ns, p > 0.05; ***, p < 0.0001; n = 12). (H) Latency to initial LIE. ANOVA with post hoc Dunnett using CS as a control: ns, p > 0.05; ***, p < 0.0001; n = 12). The heterozygous ChAT mutation caused significantly earlier onset of LIE at the ages of 2 week and 4 week.

