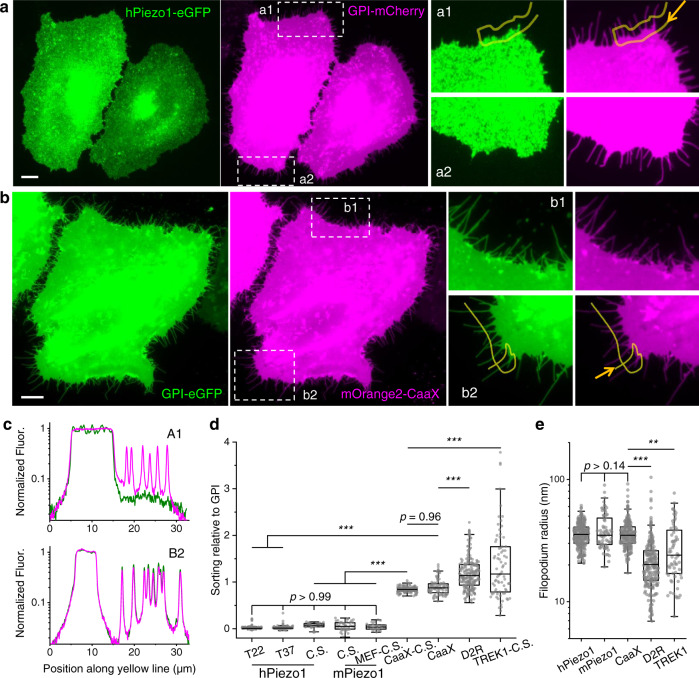
Fig. 1. Piezo1 is depleted from filopodia.
a Fluorescence images of HeLa cells co-expressing hPiezo1-eGFP (left) and GPI-mCherry (middle). The two boxed regions (a1, a2) are zoomed-in on the right. Images are contrast-adjusted to show the dim filopodia, see Fig. S1a for images under regular contrast. b Fluorescence images of HeLa cells co-expressing GPI-eGFP (left) and mOrange2-CaaX (middle). The two boxed regions (b1, b2) are zoomed-in on the right. All scale bars are 10 µm. c Fluorescence intensity profiles along the marked yellow lines in a1 (up) and b2 (down). Green: hPiezo1 (up) and GPI (down). Magenta: GPI (up) and CaaX (down). Each fluorescence trace was normalized to the mean intensity on the corresponding flat cell body. d Filopodia sorting of eGFP fused hPiezo1 (T22: at 22 °C, n.f. = 129, n.c. = 12; T37: at 37 °C: n.f. = 113, n.c. = 8), CaaX (n.f. = 87, n.c. = 9), and D2R (n.f. = 222, n.c. = 15) relative to GPI-mCherry. C.S.: color swap, indicating the molecule of interest was fused with red or orange fluorescent proteins (tdTomato for MEF, mOrange2 for CaaX, mCherry for the rest) while the reference was GPI-eGFP. hPiezo1-C.S.: n.f. = 24, n.c. = 4; mPiezo1-C.S.: n.f. = 47, n.c. = 8; mPiezo1-MEF-C.S.: n.f. = 24, n.c. = 5; CaaX-C.S.: n.f. = 123, n.c. = 9; TREK1-C.S.: n.f. = 77, n.c. = 12. n.f.: number of filopodia, n.c.: number of cells. e Filopodia radii of cells co-expressing GPI and hPiezo1 (n.f. = 266), mPiezo1 (n.f. = 71), CaaX (n.f. = 210), D2R (n.f. = 222), or TREK1 (n.f. = 65). All radii were determined from the GPI channel. Data labelled with ‘MEF’ were done in mouse embryonic fibroblasts with Piezo1-tdTomato at endogenous expression level and ‘TREK1’ were measured in HEK293T cells, all other quantifications were done in HeLa cells. p values given by one-way ANOVA with post hoc Tukey’s test. ***p < 10−7. **p < 10−3. In the box plots, the mid-lines represent the median, the box represents 25~75% range, and the whiskers represent the 1.5 inter-quartile range (same below). Source data are provided as a Source Data file (same below).

