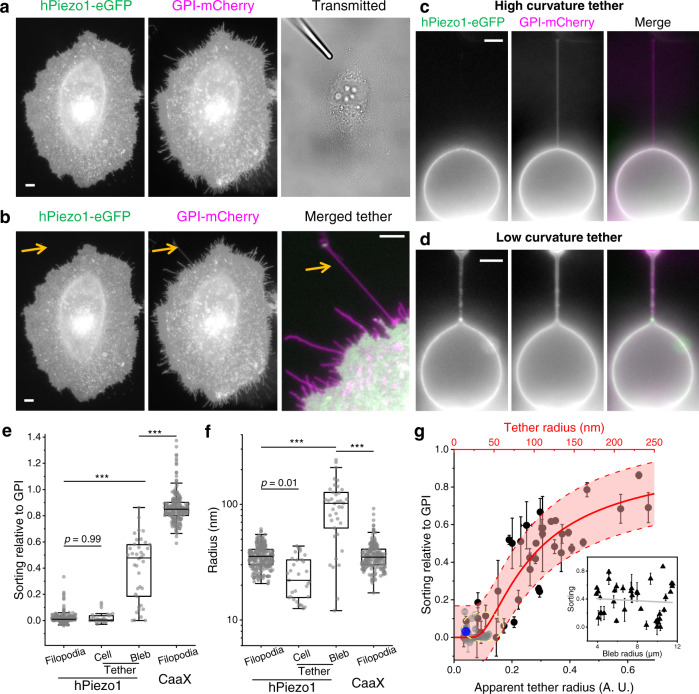
Fig. 2. Sorting of Piezo1 on membrane tethers.
a Fluorescence images of a HeLa cell co-expressing hPiezo1-eGFP (left) and GPI-mCherry (middle). The transmitted light image (right) shows the position of a motorized micropipette (fused-tip) in contact with the cell before tether pulling. b Fluorescence images of the HeLa cell in (a) after a 20 µm tether was pulled out (arrow). The tether region is merged and contrast-adjusted on the right. c, d Fluorescence images of tethers pulled from membrane blebs on HeLa cells co-expressing hPiezo1-eGFP (left) and GPI-mCherry (middle). Merged images shown on the right. Significantly less Piezo1 signals were observed on the tether from tense bleb (c) compared to the tether from floppy bleb (d). All fluorescence images are shown in log-scale to highlight the dim tether. All scale bars are 5 µm. Full images of the cell in (c) and (d) are shown in Fig. S8. e, f Sorting of hPiezo1 (e) and radii of tethers (f) pulled from cell membranes (Cell, n = 31 cells; as in a–b) and membrane blebs (Bleb, n = 38 blebs; as in c–d) relative to GPI. Corresponding data of hPiezo1 (n = 266 filopodia) and CaaX (n = 210 filopodia) from Fig. 1d, e are shown here for comparison. All radii were determined from the GPI channel. g Sorting of hPiezo1 on tethers pulled from blebs (black) plotted as a function of the apparent (lower axis) and absolute (upper axis) radii of the tethers. Sorting of hPiezo1 on tethers pulled from cells are shown in gray. The fraction of ‘outside-out’ Piezo1 when reconstituted into small liposomes (according to ref. 10) is shown in blue. The yellow circle shows the cluster of tense bleb data used to calculate absolute tether radii. The center and error band represent the best fit of Steth (n = 69 tethers) to Eq. (1) and the 95% confidence interval, respectively. Inset: Sorting of Piezo1 as a function of bleb radius (n = 38 blebs), where the line represents a linear fit with slope = −0.007 ± 0.015 µm−1. Error bars are SEM. p values given by one-way ANOVA with post hoc Tukey’s test. ***p < 10−7.

