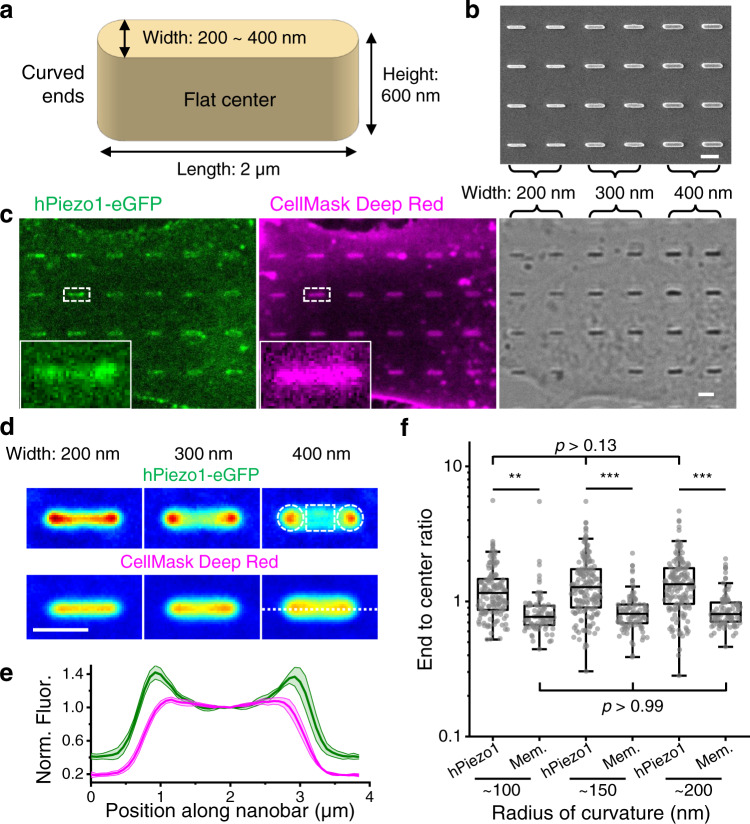
Fig. 3. Enrichment of Piezo1 towards the ends of nanobars.
a Illustration of a nanobar. b Scanning electron microscopy image of the cell culture substrate with 200, 300, and 400 nm wide nanobars. c A representative image of cells cultured on nanobar substrate (n = 8 repeats), expressing hPiezo1-eGFP (left) and stained with CellMask Deep Red (middle). The transmitted light image is shown on the right with the width of nanobars labelled on top. d Averaged fluorescence images (up: hPiezo1; down: CellMask Deep Red) of nanobars with widths of 200 nm (left; n = 141 nanobars); 300 nm (middle; n = 167 nanobars); 400 nm (right; n = 155 nanobars). Colormap: blue: low; green: medium; red: high. In the upper right image, the dashed circles and square regions are used to calculate the ‘end’ and ‘center’ signals, respectively, for all nanobar images. e Mean intensity profile along the dashed line in (d) for all three nanobar widths. Fluorescence traces are normalized to the intensity at the center of the nanobar. Green: hPiezo1; Magenta: CellMask Deep Red. Error bars are SEM (n = 463 nanobars). f Scattered plot of the ‘end’ to ‘center’ ratio for all nanobars in both the hPiezo1 channel and the CellMask channel (Mem.). Estimated radius of curvature for the curved ends are labelled on the x-axis. (~100 nm: n = 141 nanobars; ~150 nm nanobars; n = 167 nanobars; ~200 nm: n = 155 nanobars), p values given by one-way ANOVA with post hoc Tukey’s test. ***p < 10−7, **p < 10−3. All scale bars are 2 µm.

