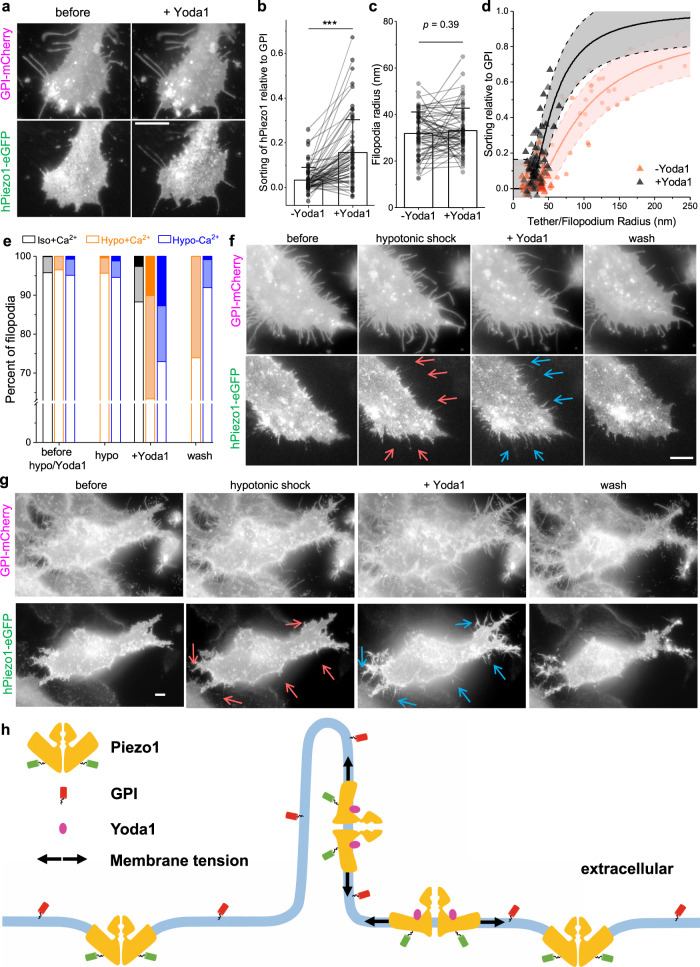
Fig. 4. Yoda1 leads to increased sorting of Piezo1 on filopodia, independent of Ca2+.
a Left: fluorescence images of a HeLa cell (full cell: Fig. S11a) co-expressing GPI-mCherry (up) and hPiezo1-eGFP (down). Right: 10 min after adding 10 µM Yoda1. b, c Quantifications of hPiezo1 sorting on filopodia (b) and filopodia radii (c), n = 66 filopodia. Bar plots show mean + SD. p values given by 2-tailed paired Student’s t test, ***p < 10−7. d Sfilo plotted as a function of filopodia radius before (red triangle) and after (black triangle) adding Yoda1. The center and error band represent the best fit of Sfilo (+Yoda1; n = 66 filopodia) to Eq. (1) ( fixed at 2400 nm2) and the 90% confidence interval, respectively. Fitted C0−1 = (4 ± 13) µm. Data from Fig. 2g shown in pink. All data points in (b)–(d) are quantified from cells cultured in regular XC and are limited to filopodia that did not significantly change positions after addition of Yoda1. e Percentage of filopodia that showed strong (Sfilo > 0.3, dark), weak (0.1 < Sfilo < 0.3, light), and no (Sfilo < 0.1, open) sorting of hPiezo1 under the labelled conditions. Black: no osmotic shock, regular XC (n = 752 filopodia, as in a); Orange: hypotonic shock, regular XC (n = 564 filopodia, as in f); blue: hypotonic shock, Ca2+-free XC (n = 771 filopodia, as in g). f, g Fluorescence images of HeLa cells in regular (f, full cell shown in Fig. S11b) and Ca2+-free (g) XC buffer. Up: GPI-mCherry. Down: hPiezo1-eGFP. Left to right: before treatments; 10 min after swelling with regular (f) or Ca2+ free (g) hypotonic buffer; 20 min after adding 10 µM Yoda1 (dissolved in regular (f) or Ca2+ free (g) hypotonic buffer); after washing 3 times with regular (f) or Ca2+ free (g) XC buffer. Red/blue arrows point to the filopodia where Piezo1 signals were absent/enhanced before/after adding Yoda1. All fluorescence images are shown in log-scale to highlight the filopodia. All scale bars are 5 µm. h Illustration showing the membrane curvature sorting of Piezo1 relative to GPI and the effect of Yoda1 and pre-stressing (arrows) on the curvature sorting of Piezo1.

