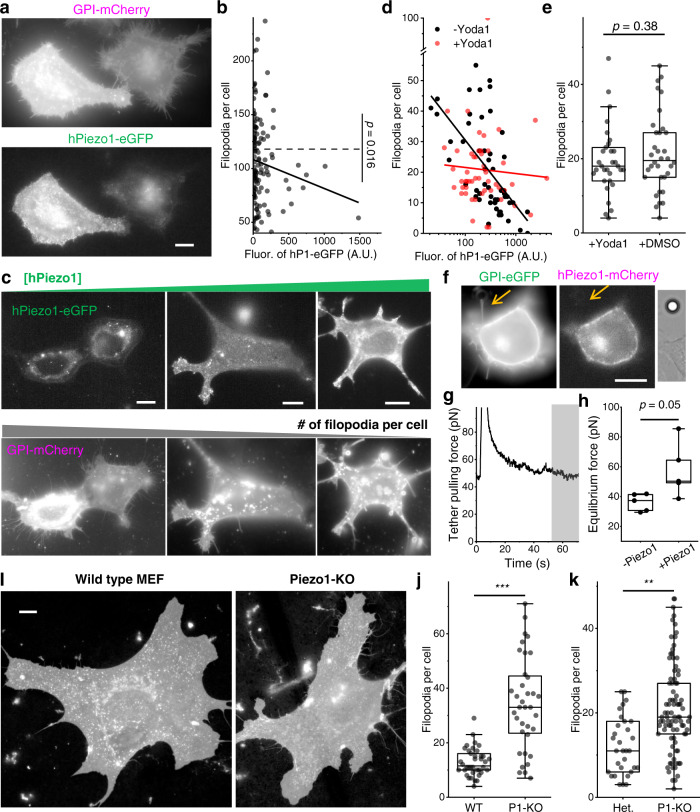
Fig. 5. Piezo1 inhibits filopodia formation.
a Fluorescence images of HeLa cells co-expressing GPI-mCherry (up) and hPiezo1-eGFP (down). b Relation between the number of filopodia and hPiezo1-eGFP expression level in HeLa cells (n = 129 cells). Dash line: average. Solid line: linear fit (Pearson’s r = −0.13). c Fluorescence images of HEK293T cells co-expressing hPiezo1-eGFP (up) and GPI-mCherry (down). d Relation between the number of filopodia and hPiezo1-eGFP expression level in HEK293T cells cultured in regular (black, n = 52 cells) and 5 µM Yoda1 containing (red, n = 50 cells) media. Lines are linear fits between y and log(x). Without Yoda1 (black): slope = −21.5 ± 4.0, Pearson’s r = −0.61. With Yoda1 (red): slope = −2.0 ± 5.0, Pearson’s r = −0.06. e The number of filopodia per Piezo1-KO MEF incubated with 5 µM Yoda1 (n = 31 cells) or 0.1% DMSO (n = 34 cells). f A HEK293T cell co-expressing hPiezo1-eGFP (left) and GPI-mCherry (middle), with a tether (arrow) pulled by an optically-trapped bead (right). g Time dependent pulling force for the tether in (f). The tether was stretched at t = 3 s. The gray area was used to calculate the equilibrated pulling force. h Equilibrium tether pulling force for HEK293T cells only expressing GPI-eGFP (−Piezo1; n = 5 cells) or co-expressing hPiezo1-mCherry and GPI-eGFP (+Piezo1; n = 5 cells). i Representative (of the median filopodia number) fluorescence images of WT (left) and Piezo1-KO (right) MEF, both stained with CellMask Deep Red. MEFs were from littermate embryos dissected on the same day. j The number of filopodia per cell for WT (n = 38 cells) and Piezo1-KO (P1-KO; n = 36 cells) MEFs from a pair of littermates. Cells were imaged 30 days after dissection. k The number of filopodia per cell for Het. (n = 32 cells) and P1-KO (n = 89 cells) MEFs from a pair of littermates. Cells were imaged 52 days after dissection. All fluorescence images are shown in log-scale to highlight the filopodia. All scale bars are 10 µm. p values given by two-tailed Student’s t test after checking for normality. ***p < 10−7, **p < 10−3.

