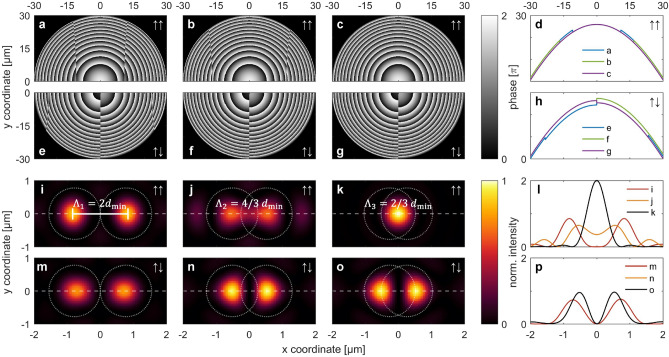
Figure 2.
Comparison of in-phase (↑↑) and opposite-phase (↑↓) configuration for the situation of two foci (N = 2) for different inter-focal distances Λ. (a)–(c) Phase holograms in the aperture plane (z = 0) for the ↑↑ case: (a) Λ1 = 2 dmin, (b) Λ2 = 4/3 dmin, (c) Λ3 = 2/3 dmin, together with their unwrapped phase profiles (having the 2π modulus removed) along y = 0 shown in (d). (e)–(h) Respective phase distributions for the ↑↓ scenario. (i)–(k) Intensity distributions in the focal plane (z = f) obtained from the holograms shown in (a)–(c) (↑↑ case). (l) Corresponding profiles along y = 0 direction (horizontal dashed lines in (i)–(k)). (m)–(p) Corresponding distributions for the ↑↓ case (scenarios (e)–(h)). Note that the yellow curve in (p) is identical to and lies underneath the black curve. The maximum intensity (I0) of all double focus distributions was used for normalization of the data in (i), (j), and (l)–(p). For better visibility, the data in (k) were normalized by 2I0.

