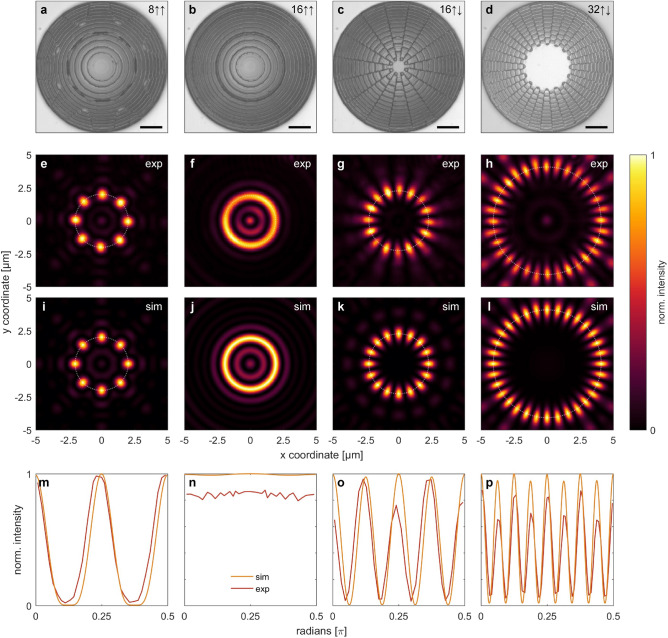
Figure 4.
(a)–(d) Selected examples of implemented CGHs, (e)–(h) measured and (i)–(l) simulated intensity distributions in the focal plane for the situation where a discrete number of foci are located on an annulus of circumference . (m)–(p) show the corresponding comparisons of the azimuthal intensity distributions along the white dotted circles. Each column refers to a different configuration (from left to right): (a), (e), (i), (m) , , ; (b), (f), (j), (n) , , ; (c), (g), (k), (o) , , ; (d), (h), (l), (p) , , . The scale bars in the top row refer to 10 µm.

