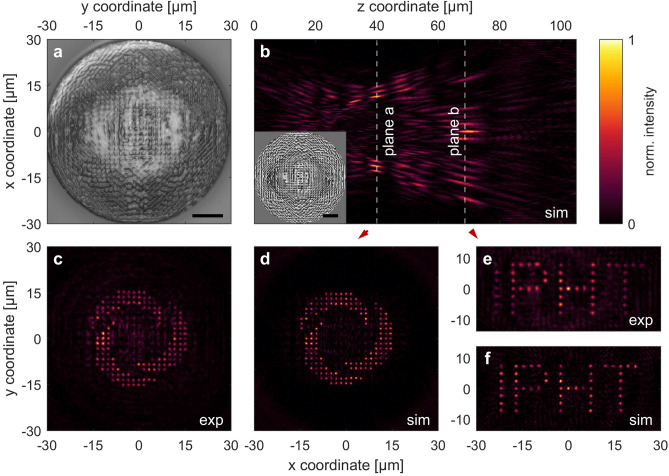
Figure 5.
Implemented CGH (a) and measured/simulated intensity distributions (b)–(f) of a fiber-interfaced 3D multi-focus hologram, creating 192 foci in two image planes behind a single-mode fiber. (a) Experimentally realized 3D nano-printed CGH on the facet of an SMF containing a core-less beam expansion section (scale bar 10 µm). (b) Simulated intensity distribution along the beam propagation axis (xz-plane). The inset shows the simulated CGH in the aperture plane at (scale bar 10 µm). The image (xy-) planes are located at and behind the facet. (c, d) Measured and simulated intensity distribution in the first focal plane, showing the logo of the authors’ institution (, ). (e, f) Measured and simulated patterns in the second plane, showing the institute’s lettering (, ).

