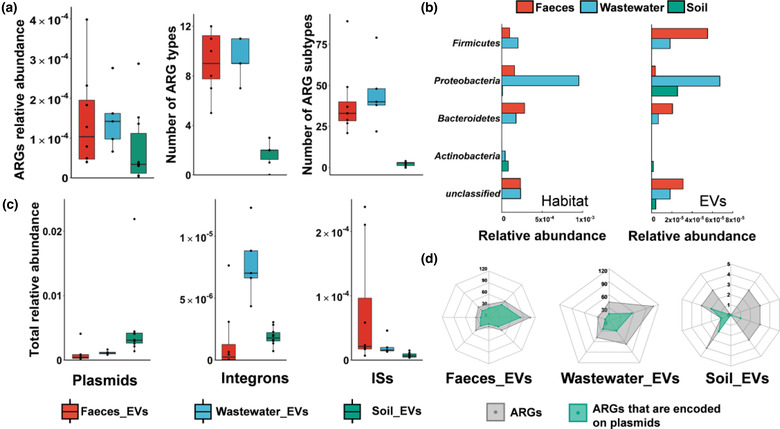
FIGURE 4.

Characterization of ARG and MGE profiles in the EVs samples. a, Relative abundance of EVs‐associated ARGs at the level of total relative abundance, antibiotic types, and drug types. Data were presented as box plots (middle line, median; lower hinge, first quartile; upper hinge, third quartile; lower whisker, the smallest value at most 1.5 × the interquartile range from the hinge; upper whisker, the largest value no further than 1.5 × the interquartile range from the hinge; data beyond the whiskers were outlying points). b, Characterization of the bacteria phyla of ARG profiles in EVs and corresponding sourced habitat. Abundance of ARGs that were found in various bacteria phyla. To facilitate viewing, only those five dominant phyla are shown. Habitat samples and EVs samples are shown separately. c, Total relative abundance of MGEs, including plasmids, integrons and ISs in the EVs samples. d, The number of the total ARGs and the ARGs encoded on the plasmid. The grey plots represented the number of ARGs in each sample, while the green plots indicated the number of ARGs encoded on the plasmid in each sample.
