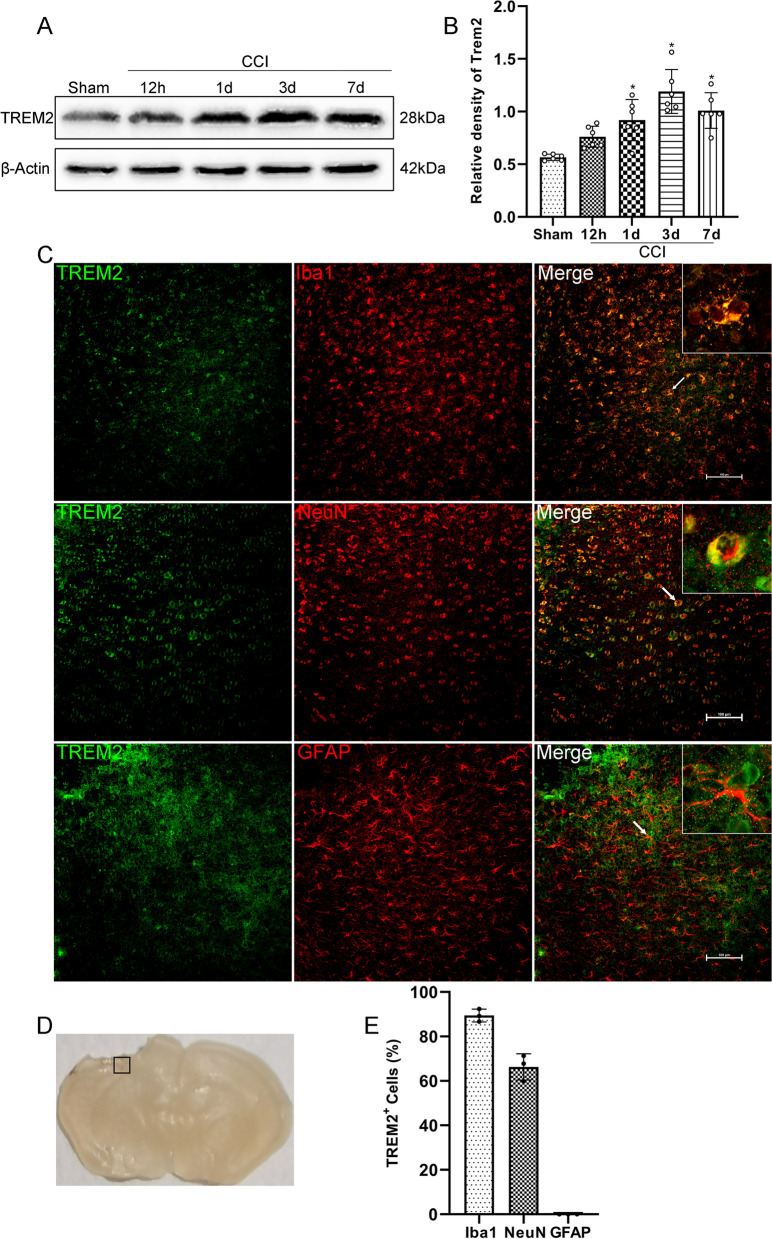
Fig.2.
Time course and cellular localization of TREM2. A Representative Western blot bands of TREM2 expression at the lesion site over time. B Quantitative analysis of TREM2 time course expression. *p < 0.05 vs. Sham group. n = 6 per group. C Representative images of the colocalization of TREM2 (green) with microglia (Iba1, red), neurons (NeuN, red), and astrocytes (GFAP, red) at the lesion site at 3 d after CCI. Nuclei were stained with DAPI (blue). Scale bar = 100 μm, n = 3. D Brain sample with schematic illustration showing the area (indicated by black box) used for immunofluorescence analysis. E Quantitative analysis of the percentage of TREM2-Iba1+ cells to Iba1+ cells, TREM2-NeuN+ cells to NeuN+ cells, and TREM2-GFAP+ cells to GFAP+ cells. n = 3

