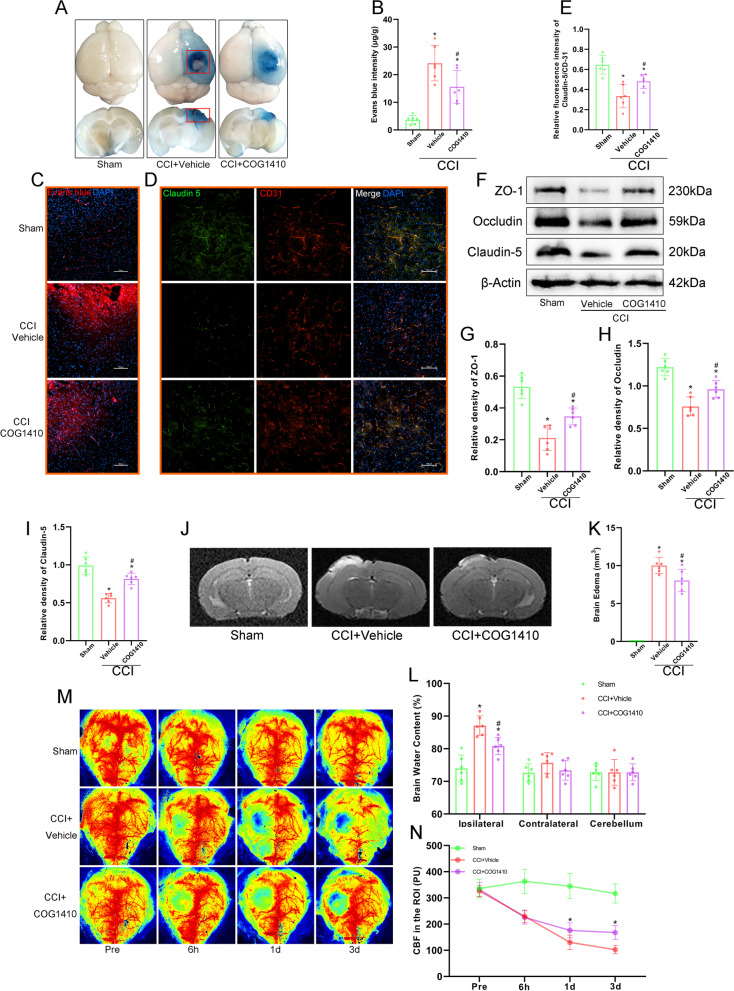
Fig. 4.
COG1410 treatment attenuated BBB disruption, brain oedema, and CBF decrease after CCI. A Representative horizontal and coronal images of brains after EB injection. The red boxes represent the area of brain tissue extraction in Western blot analysis. B Quantitative analysis of EB leakage intensity. *p < 0.05 vs. Sham; #p < 0.05 vs. CCI + Vehicle, n = 6 per group. C Red fluorescence of EB was observed by fluorescence microscopy in different groups. Nuclei were stained with DAPI (blue). Scale bar = 100 μm. n = 3 per group. D Representative images of double immunofluorescence staining of Claudin-5 and CD31. Nuclei were stained with DAPI (blue). Scale bar = 100 μm. E Quantitative analysis of the relative Claudin-5 fluorescence intensity in different groups. *p < 0.05 vs. Sham; #p < 0.05 vs. CCI + Vehicle, n = 6 per group. F Representative Western blot bands of ZO-1, Occludin, Claudin-5, and β-Actin at the lesion sites after CCI. G–I Quantitative analysis of relative ZO-1 (G), Occludin (H), and Claudin-5 (I) density. *p < 0.05 vs. Sham; #p < 0.05 vs. CCI + Vehicle, n = 6 per group. J Representative images of MRI scanning at 3 d after CCI. K Quantitative analysis of brain oedema volume at 3 d after CCI. *p < 0.05 vs. Sham; #p < 0.05 vs. CCI + Vehicle, n = 6 per group. L Quantitative analysis of brain water content at 3 d after CCI. *p < 0.05 vs. Sham; #p < 0.05 vs. CCI + Vehicle, n = 6 per group. M Representative images of CBF by LSCI in different groups at different timepoints. N Quantitative analysis of continuous CBF changes before and after CCI. *p < 0.05 vs. CCI + Vehicle, n = 6 per group

