Fig. 9.
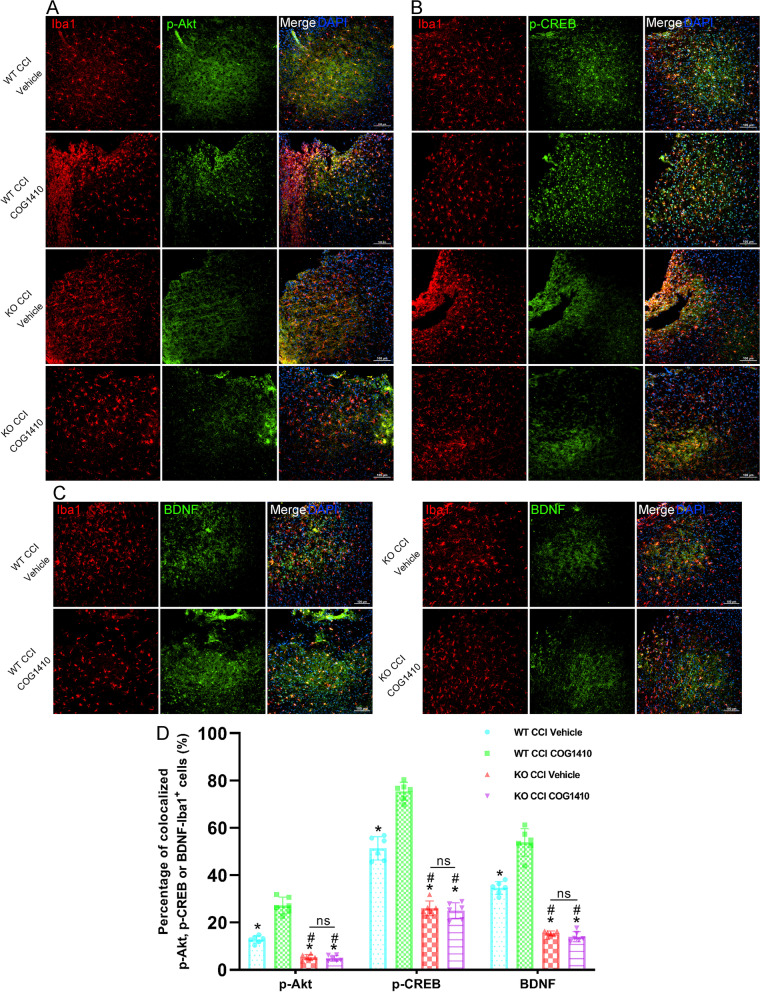
Activation of the Akt/CREB/BDNF signalling axis occurred in microglia. A Representative images of microglia (Iba1, red) and p-Akt+ cells (p-Akt, green) surrounding the lesion sites at 3 d after CCI. Nuclei were stained with DAPI (blue). Scale bar = 100 μm. B Representative images of microglia (Iba1, red) and p-CREB+ cells (p-CREB, green) surrounding the lesion sites at 3 d after CCI. Nuclei were stained with DAPI (blue). Scale bar = 100 μm. C Representative images of microglia (Iba1, red) and BDNF+ cells (BDNF, green) surrounding the lesion sites at 3 d after CCI. Nuclei were stained with DAPI (blue). Scale bar = 100 μm. D Quantitative analysis of the percentage of colocalized p-Akt-Iba1 + cells, p-CREB-Iba1 + cells, and BDNF-Iba1 + cells. *p < 0.05 vs. WT CCI + COG1410; #p < 0.05 vs. WT CCI + Vehicle; ns p > 0.05 KO CCI + Vehicle vs. KO CCI + COG1410, n = 6 per group

