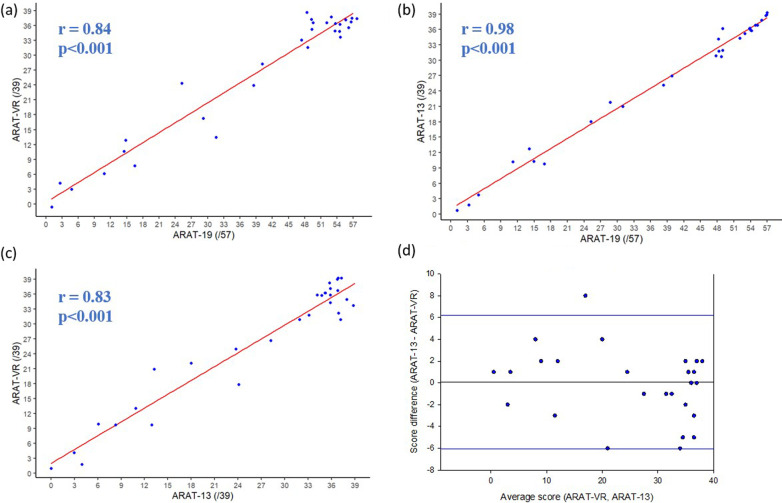
Fig. 2.
Correlations between ARAT and ARAT-VR scores. a In this correlation plot, each point represents paretic hand’s score obtained when performing the ARAT-VR in relation to the ARAT-19 score. Spearman correlation coefficients (r) and their p-value (p) are presented at the left side of the graph. A linear regression is plotted in red. b In this correlation plot, each point represents the ARAT-13 paretic hand’s score in relation to the ARAT-19 score. Spearman correlation coefficients (r) and their p-value (p) are presented at the left side of the graph. A linear regression is plotted in red. c In this correlation plot, each point represents paretic hand’s score obtained when performing the ARAT-VR in relation to the ARAT-13 score. Spearman correlation coefficients (r) and their p-value (p) are presented at the left side of the graph. A linear regression is plotted in red. d In this Bland–Altman plot, each point represents the paretic hand’s average ARAT score, computed by pooling both ARAT-VR and ARAT-13 results, in relation to the paretic hand’s ARAT score difference, computed by subtracting the ARAT-VR to the ARAT-13 results. The horizontal black line represents the mean ARAT score difference and the horizontal red lines, the limits of agreement regarding this mean ARAT score difference (mean difference ± 1.96 standard deviation)

