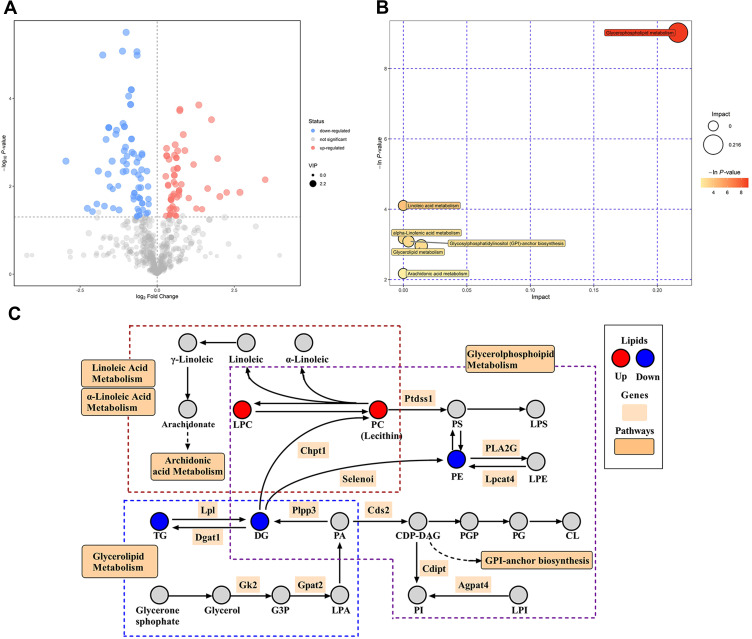
Figure 6.
Different lipid visualization outcomes and KEGG metabolic pathways are impacted. (A) The filtered differential lipids volcanic map. Red denotes upward movement, blue denotes downward movement, and the size of the circle denotes the VIP. (B) Pathway analysis for group LPS vs LPS+LYC. It was discovered that LYC had an impact on six different pathways, including glycerophosphatide, glycerolides, linoleic acid, and arachidonic acid. (C) Schematic plot of the selected related pathways. Clearly demonstrate the connections between certain metabolic pathways and alterations in the concentrations of key lipids.

