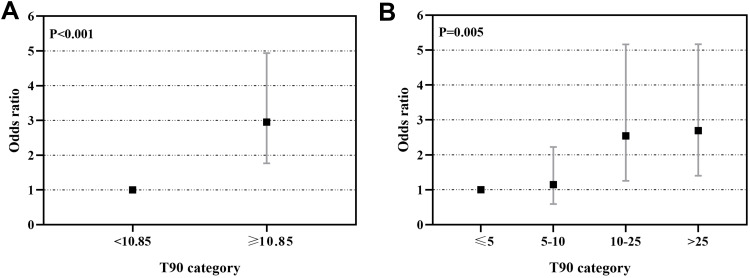
Figure 4.
Odds ratios and 95% confidence intervals (CI) for T90 severity categories and prevalent hypertension. Binary logistic regression models were fitted to examine the association between T90 categories and prevalent hypertension in patients with severe OSA. (A) T90 categories were associated with increased risk of hypertension in severe OSA patients. (B) The risk of hypertension increased across light hypoxia group to severe hypoxia group in severe OSA patients.
Notes: Adjusted for age, BMI, and family history of hypertension. Light hypoxia was defined as T90≤5%, mild hypoxia was defined as T90 accounting for 5–10%, moderate hypoxia was defined as T90 accounting for 10–25%, severe hypoxia was defined as T90>25%.
Abbreviation: T90, proportion of cumulative sleep time with oxygen saturation below 90% in total sleep time.

