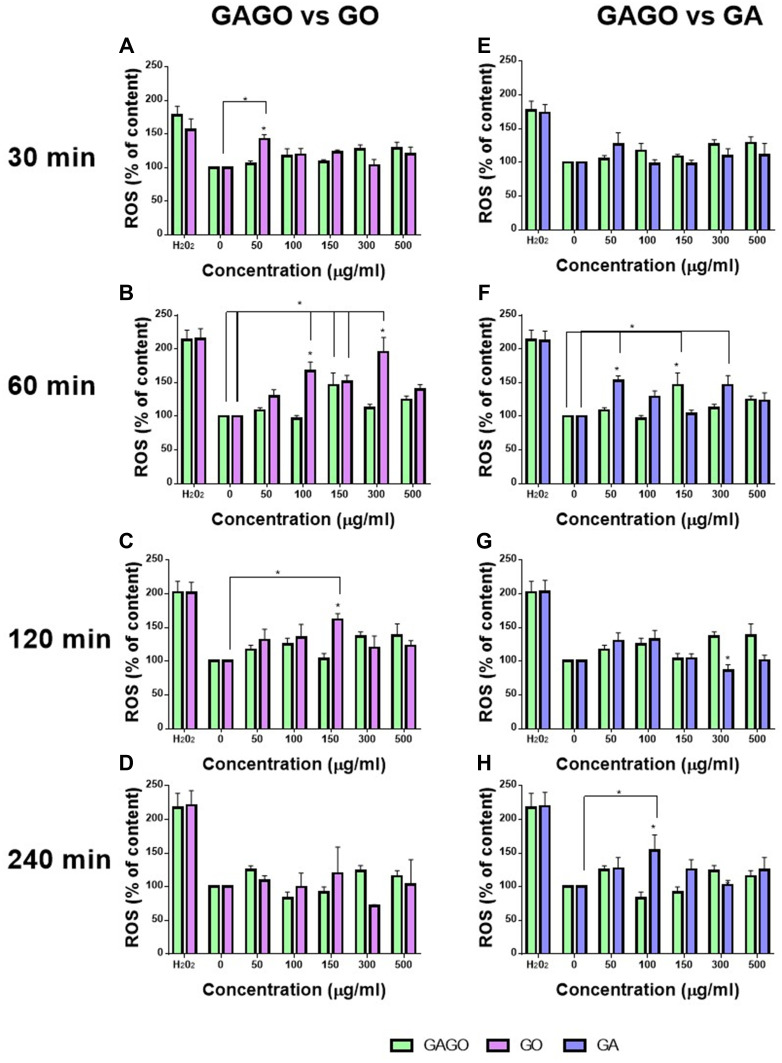
Figure 9.
Reactive Oxygen Species content (ROS). This figure shows the ROS content on zebrafish embryos treated with GO, GA, and GAGO at four time points (30, 60, 120, and 240 min). (A–D) shows the comparison of ROS content between GAGO and GO, while (E–H) shows the comparison of ROS content between GAGO and GA. Significant differences between experimental groups are denoted by “*” (Two-way ANOVA, followed by a post hoc test: Dunnet’s, p ≤ 0.05).

