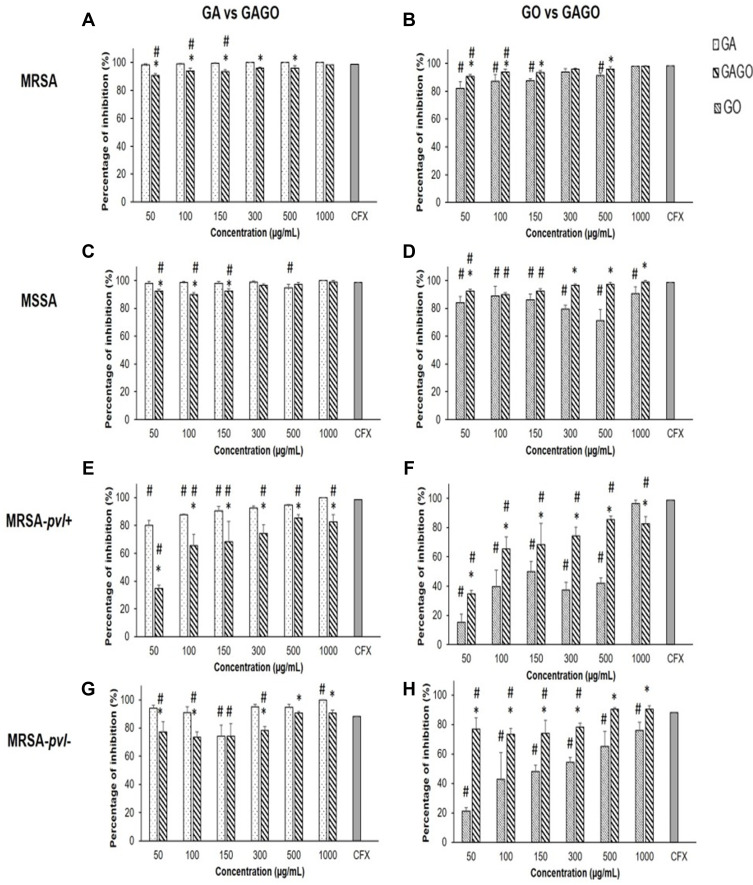
Figure 12.
Percentage of inhibition of (A–B) MRSA, (C–D) MSSA, (E–F) MRSA-pvl+, and (G–H) MRSA-pvl- following exposure to GA, GO, and GAGO for 18 h at different concentrations (50–1000 µg/mL) compared to the positive control, CFX. Data represent mean ± SD (n = 3). Significant differences between experimental groups are denoted by * and #Denotes significant differences in CFX (One-way ANOVA, followed by a post-hoc Tukey’s test, p ≤ 0.05).

