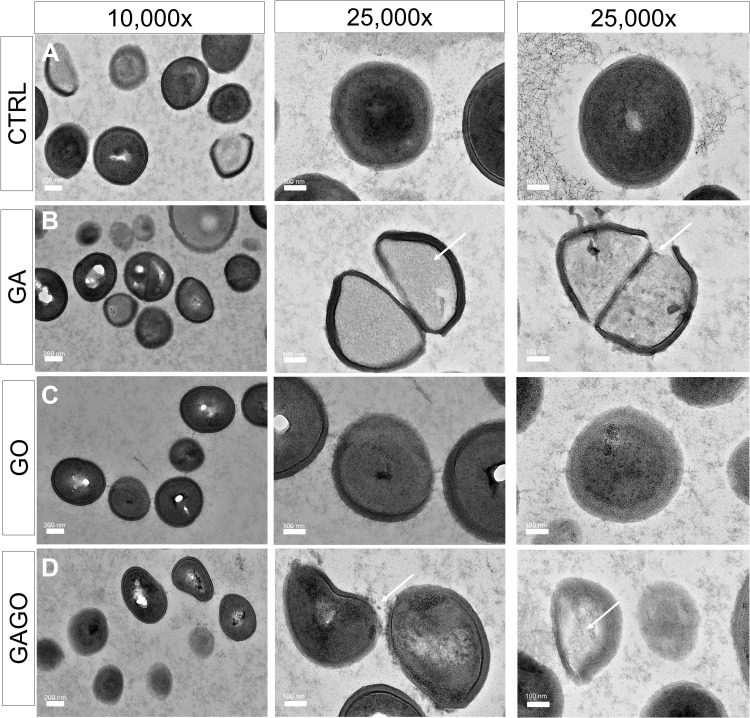
Figure 15.
HRTEM micrographs of MSSA treated with (A) distilled water (CTRL), (B) GA, (C) GO, and (D) GAGO at 150 µg/mL for 12 h. Scale bars represent 200 nm (10,000× magnification) and 100 nm (25,000× magnification). Arrows indicate a compromised membrane with cell lysis, that results in cytoplasm leakage and reduced cellular content.

