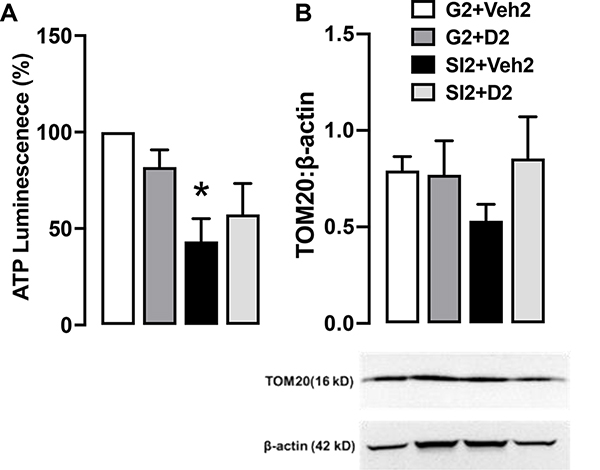
Fig. 2. ATP and TOM20.
A. Normalized hippocampal ATP bioluminescence shown as percentage in comparison to the control. N = 3 per group. B. TOM20 blotted on the same gel as β-actin. Blot is shown as different parts of the same gel. Bars show quantification of TOM20 with β-actin as the loading control. N = 4 per group. Two-way ANOVA with multiple comparisons, Holm Sidak method, *, p ≤ 0.01 vs G2+Veh2.

