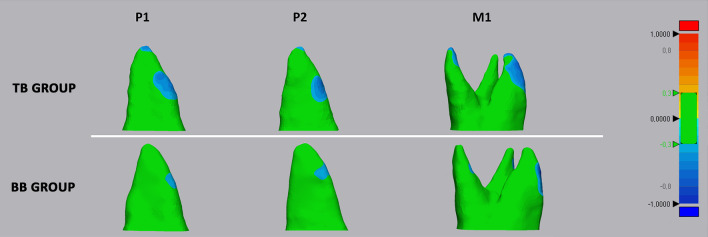
Fig. 5.
Deviation analysis between the T0 and T1 radicular models of first molar (M1), first premolar (P1), and second premolar (P2) in both tooth-borne (TB) and bone-borne (BB) expander groups. The colored map shows the deviations (negative blue, positive red) between the mesh models. The range of tolerance (green color) was set at ± 0.3 mm. The color-coded map showed that the reduction in cementum (blue-tone) was localized in the apical, bucco-apical, and bucco-medial radicular areas of both abutment and un-anchored teeth in the TB group. A similar resorption pattern was identified in the BB group, despite the absence of detectable deviation at the apex

