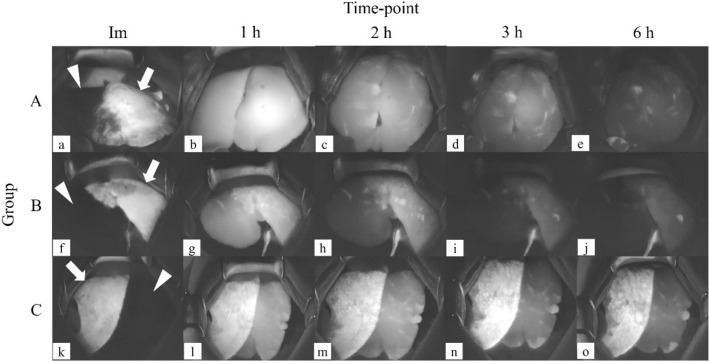
Fig. 2.
Representative images obtained using the infrared camera system showing the changes in the liver surface of the lateral or medial left lobe over time in one swine per group. The indocyanine green (ICG)-injected regions are shown in white (arrows) and non-injected regions in black (arrowheads). The regions with ICG are shown in a gradation of white to gray, depending on the amount of ICG. The retention of ICG is clearer in group C (k–o) than in groups A (a–e) and B (f–j). Images were taken immediately after the procedure (a, f, k; Im), and at 1 h (b, g, l; 1 h), 2 h (c, h, m; 2 h), 3 h (d, i, n; 3 h), and 6 h (e, j, o; 6 h) after the procedure

