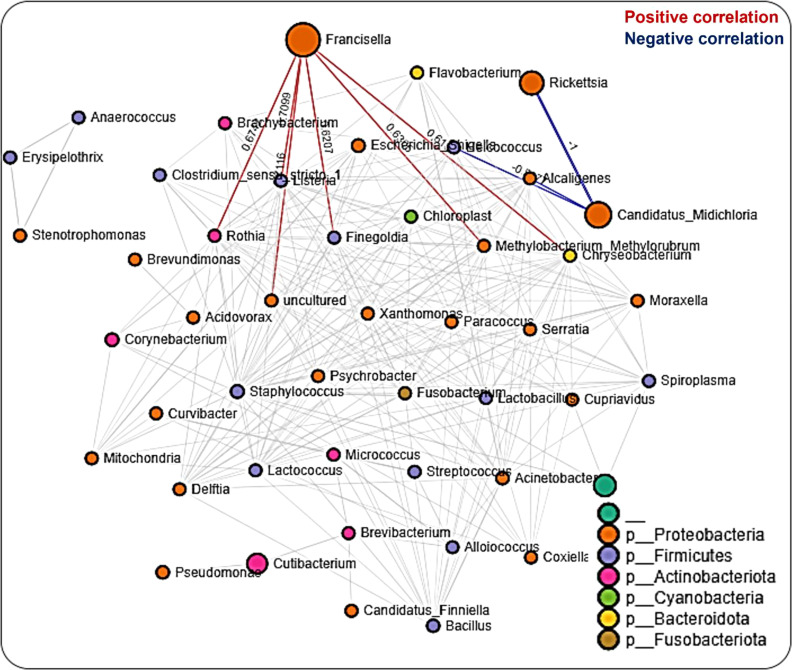
Figure 6.
Correlation network analysis in the salivary glands of Am. maculatum ticks. Correlation network generated using the SparCC algorithm. Correlation network with nodes representing taxa at the family level and edges representing correlations between taxa pairs. Node size correlates with the number of interactions in which a taxon is involved, and the line color represents either positive (red) or negative (blue) correlations. The color-coded legend shows the bacterial family to which each taxon belongs.

