FIGURE 3.

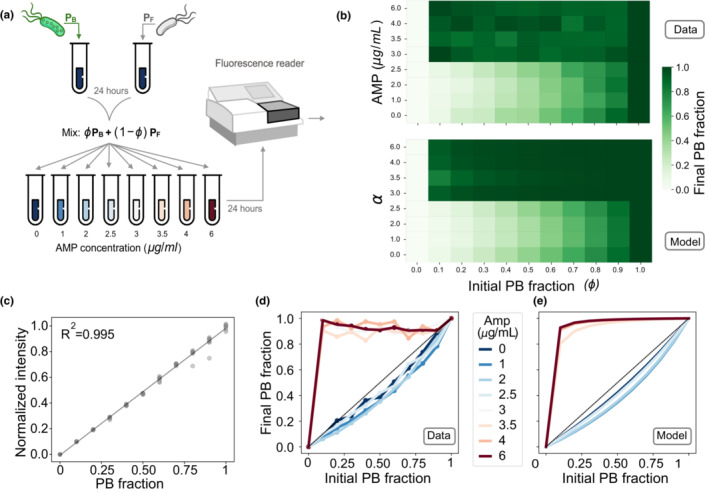
Competition experiment under a range of drug concentrations. (a) Schematic diagram illustrating an experiment where PB and PF are mixed at different relative abundances and submitted to a range of ampicillin concentrations (0, 1, 2, 2.5, 3, 3.5, 4, and 6 μg/ml). We use a fluorescence spectrophotometer to estimate the relative abundance of plasmid‐bearing cells in the population after 24 h of growth. (b) Final PF frequency (illustrated in a gradient of green) for different initial fraction of PB cells and selection coefficients (top: Data; bottom: Model). (c) Control experiment illustrating that normalized fluorescence intensity is correlated with the fraction of the population carrying plasmids. Each dot presents a replica and the dotted line a linear regression (R 2 = .995). (d) Experimental iterative map showing the existence of a minimum drug concentration that rescues the PB population (red lines). At low drug concentrations (blue lines), the PB population decreases in frequency. (e) Theoretical iterative map obtained by numerically solving Equation (2) for a range of strength of selections and initial PB frequencies. By fixing κ n (previously estimated by growing each strain in monoculture), we fitted parameter α in Equation (2) to the experimental data. Colors indicate the strength of selection (in blue), values of α where the cost of carrying plasmids is stronger than the benefit resulting from positive selection, yielding curves below the identity line. Red curves represent simulations obtained with values of α strong enough to kill PF cells, thus increasing PB frequency in the population.
