
FIGURE 6.
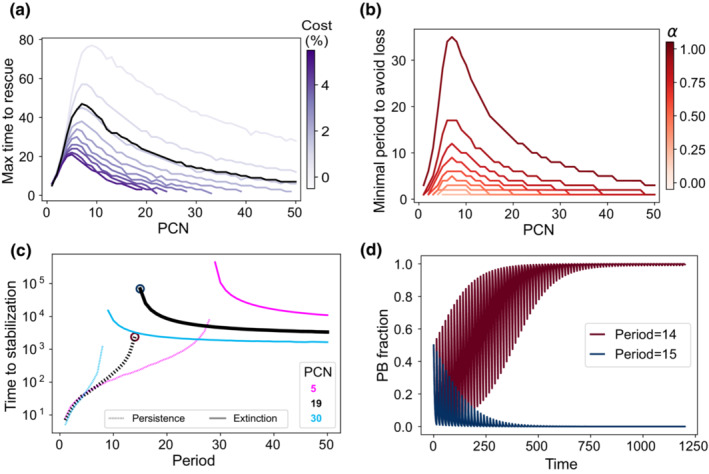
Numerical results of the model in periodic environments. (a) Maximum time a plasmid population can grow without antibiotics to avoid plasmid loss when applying a strong antibiotic pulse. Curves represent how this time is affected by PCN. Blue intensity represents plasmid cost, and black line indicates results using the pBGT parameters. (b) Minimal period required to avoid plasmid extinction. Simulations were performed using the pBGT measured cost (κ = 0.014). Red intensity represents different values of α. Note that higher values of α increase the minimal period. (c) Time required for trajectories to stabilize for copy numbers 5, 19, and 30 using α = 0.99 and the measured cost per plasmid. Note that there is a critical period that defines fixation or coexistence marked by red and blue circles on the PCN = 19 (black) curve. (d) Trajectories for the critical periods of PCN = 19 starting from 0.5 PB‐PF frequency. Note that 1‐day period difference leads to opposite outcomes.