FIGURE 7.

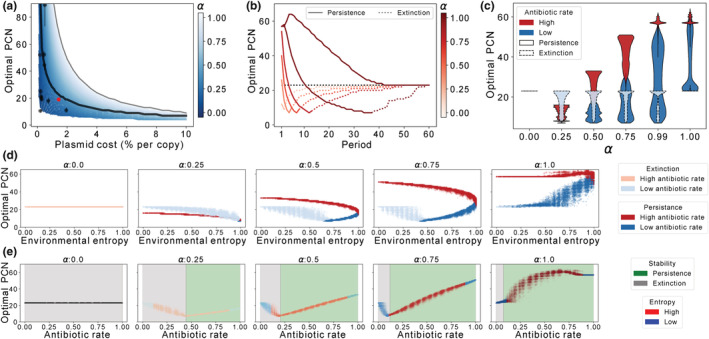
Optimal PCNs in fluctuating environments. (a) Optimal plasmid copy number (PCN*) as the number of copies that maximizes the area under the curve of Figure 4b. PCN* decreases exponentially as we increase the fitness cost associated with carrying plasmids, as indicated in black solid line. Black dots show some PCN‐costs data obtained from the literature. Red dots indicate the values of pBGT. Blue‐scale lines indicate optimal PCN curves for many values of α. Light‐blues indicate higher values of α whereas dark‐blues indicate lower values of α. Gray line shows the max PCN for the corresponding plasmid cost. (b) Optimal PCN in periodic environments. Each curve corresponds to a value of α. Black line shows α = 0. Observe that for very short periods optimal PCNs are high, then for certain period the optimal PCN reaches a minimum then as period increases, the optimal PCN tends to the optimal of α = 0. (c–e) Optimal PCNs using random environments. (c) Environments are classified by their rate of days with antibiotics, the rate differences produce a multimodal outcome, where higher rates increase the optimal PCN and vice versa. Simulations using the same environments were made for different αs. Note that α intensity increases the separation of the modes. Modes are also classified by their stability, persistence marked with a solid border line and extinction with a dashed border line. (d) Panel of optimal PCNs plotted by the environment entropy for sample α. Environments are classified by their antibiotic rate. (e) Panel of optimal PCNs plotted by the environment antibiotic rate for sample α. Environments are classified by their entropy.
