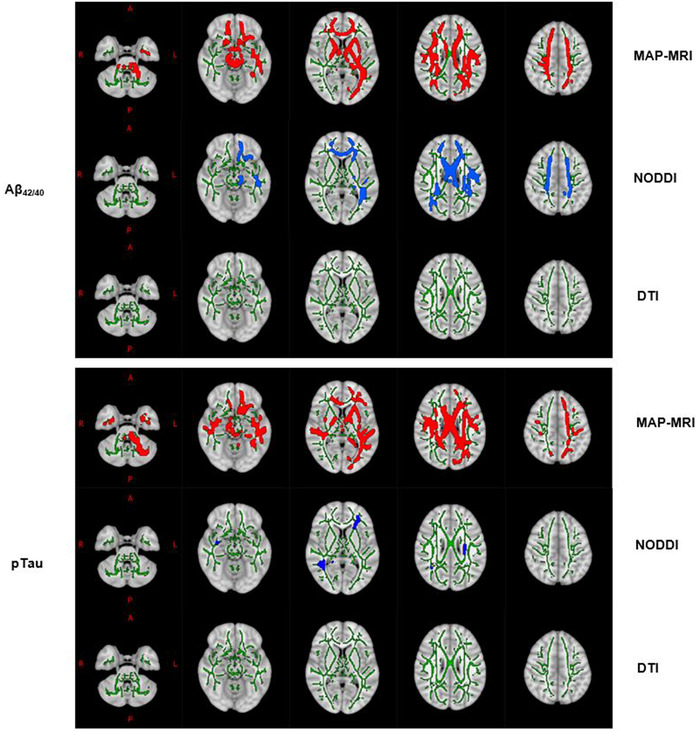
FIGURE 2.

WM skeleton voxels (highlighted using the TBSS_fill command) with significant associations between CSF markers (top panel: Aβ42/40, bottom panel: pTau) and DWI Metrics (MAP‐MRI: Red, NODDI: Blue, DTI: None) overlaid on the 1 mm MNI 152 standard T1 template. WM is delineated by the mean FA skeleton of all subjects (green). Results are corrected for age, sex, and multiple comparisons across voxels with p < 0.05.
