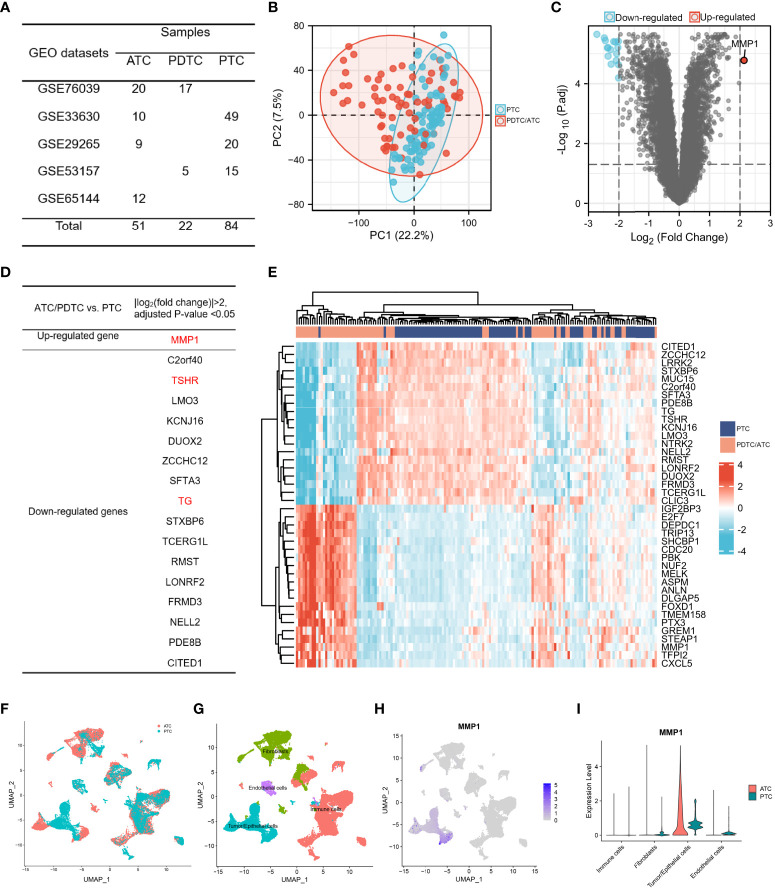
Figure 2.
The identification of MMP1. (A) TC samples from the GEO database included in this study; (B) PCA map between PDTC/ATC and PTC. The difference between PTC and PDTC/ATC samples was not very large. (C) Volcano plots exhibited the DEGs between PDTC/ATC and PTC. (D) List of DEGs between PDTC/ATC and PTC. (E). Heat map of MMP1 and another top 40 DEGs between PDTC/ATC and PTC. (F) Single-cell sequencing data in five ATC and six PTC patients. (G) Four basic types of cells in single cell sequencing data: tumor/epithelial cells, immune cells, endothelial cells and fibroblasts. (H) MMP1 expression in different cells. (I) Relative quantification of MMP1 expression level. GEO, the Gene Expression Omnibus; PDTC, poorly differentiated thyroid cancer; ATC, anaplastic thyroid cancer; PTC, papillary thyroid cancer; DEG, differentially expressed gene.

