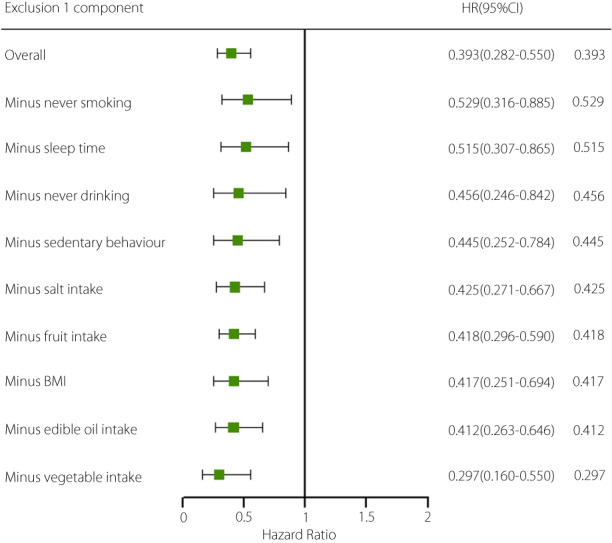
Figure 4.

Hazard ratios (95% confidence intervals) associated with extreme categories (0–3 vs 7–9) of the nine healthy lifestyle factors after subtraction of one factor at a time. Adjusted for age (<45/≥45 years), gender, community, education years (≥9/<9), family history of diabetes (no/yes), hypertension (no/yes), dyslipidemia (no/yes), and corresponding subtracted components.
