Figure 4.
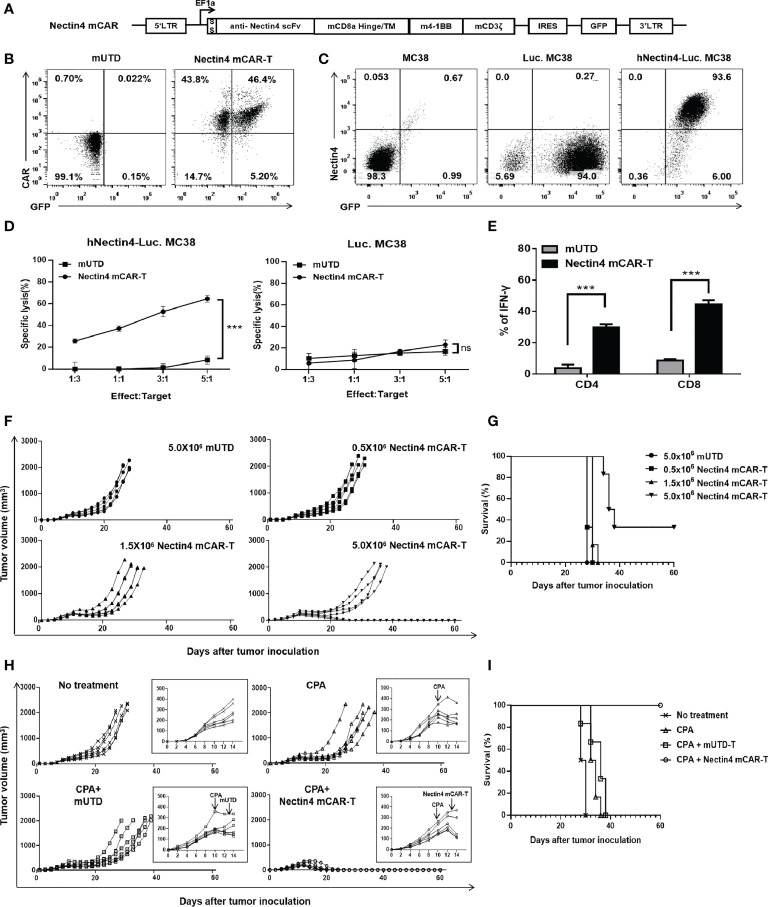
Therapeutic effect of Nectin4 mCAR-T cells on metastatic colorectal cancer in fully immune-competent mice. (A) The murine CAR construct was inserted upstream of an IRES-GFP marker in the MSCV retroviral plasmid pMIGR1. (B) mCAR expression of Nectin4 mCAR-T cells transfected with pMIGR1-mCAR-IRES-GFP retroviral particles. mUTD indicates the untransduced mouse T cells. (C) Nectin4 and GFP expression of Luc. MC38 cells and hNectin4-Luc. MC38 cells. (D) Quantified data on the specific lytic levels of Nectin4 mCAR-T cells against Luc. MC38 or hNectin4-Luc. MC38 cells were assessed by luciferase bio-luminescence technique at different Effect/Target ratios in vitro. ***p < 0.001, t-test. (E) Secretion of IFN-γ in CD4+ and CD8+ T subsets was assessed by flow cytometry after co-culture of Nectin4 mCAR-T cells or mUTD with hNectin4-Luc. MC38 cells for 12 h. ***p < 0.001, t-test. (F, G) C57BL/6 mice were s.c. inoculated with 1 × 10⁶ hNectin4-Luc. MC38 cells on Day 0 and injected i.v. with 5.0 × 10⁵ to 5.0 × 10⁶ Nectin4 mCAR-T cells on Day 10. A total of 5.0 × 10⁶ mUTD served as a negative control (N = 6 mice per group). Solid lines represent each individual mouse (F). Kaplan–Meier survival curve is shown in (G). p-values of log-rank tests were as follows: p = 0.35 (mUTD vs. 0.5 × 10⁶ Nectin4 mCAR-T); p = 0.09 (mUTD vs. 1.5 × 10⁶ Nectin4 mCAR-T); p = 0.0012 (mUTD vs. 5.0 × 10⁶ Nectin4 mCAR-T). (H, I) C57BL/6 mice were s.c. inoculated with 1.0 × 10⁶ hNectin4-Luc. MC38 cells on Day 0. Cyclophosphamide was i.p. administered at 100 mg/kg on Day 10 and 5.0 × 10⁶ Nectin4 mCAR-T cells or mUTD were i.v. injected on Day 13 (N = 6 mice per group). Solid lines represent each individual mouse (H). Kaplan–Meier survival curve is shown in (I). p-values of log-rank tests were as follows: p = 0.001 (CPA+Nectin4 mCAR-T vs. No treatment); p = 0.0006 (CPA+Nectin4 mCAR-T vs. CPA); p = 0.0008 (CPA+Nectin4 mCAR-T vs. CPA+mUTD).

