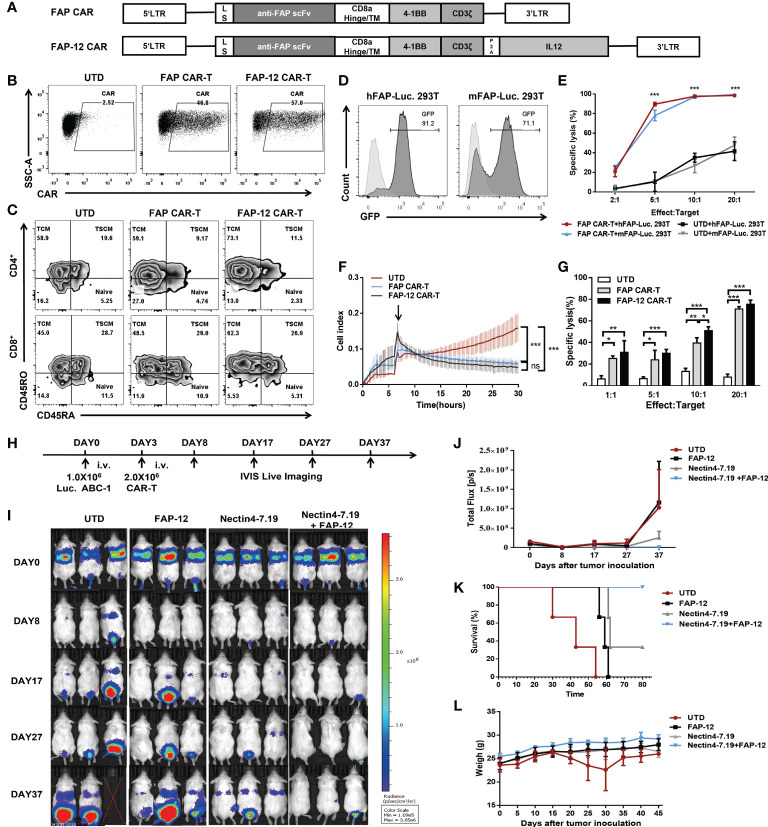
Figure 6.
Synergistic effect of Nectin4-7.19 CAR-T with FAP-12 CAR-T therapy on metastatic lung cancer mouse model. (A) Schematic illustration of FAP CAR and FAP-12 CAR lentiviral vector. LS: leader signal. (B) CAR expression on FAP CAR-T and FAP-12 CAR-T cells. (C) Expression of CD45RA and CD45RO in CD4+ or CD8+ T subset to assess the subtypes of T cells. (D) 293T cells were transduced with lentivirus encoding the human FAP-Firefly-Luciferase-GFP gene or the murine FAP-Firefly-Luciferase-GFP gene to generate hFAP-Luc. 293T and mFAP-Luc. 293T cells, respectively. Expression of GFP was measured by flow cytometry. 293T cells served as negative controls. (E) Quantified data on the specific lytic levels of FAP CAR-T cells against hFAP-Luc. 293T and mFAP-Luc. 293T cells were assessed by luciferase bio-luminescence technique at different Effect/Target ratios in vitro. UTD served as a negative control. (F) Cytotoxicity of FAP CAR-T and FAP-12 CAR-T cells was detected at an Effect/Target ratio of 10:1 by xCELLigence RTCA label-free technology. (G) Specific lysis of FAP CAR-T and FAP-12 CAR-T cells against hFAP-Luc. 293T was detected by luciferase bio-luminescence technique at different Effect/Target ratios in vitro. (H) NSG mice were inoculated with 1.0 × 10⁶ Luc. ABC-1 cells i.v. on Day 0 and received an administration of 2 × 10⁶ FAP-12 CAR-T cells, 2 × 10⁶ Nectin4-7.19 CAR-T cells, or an admixture of 1 × 10⁶ Nectin4-7.19 CAR-T cells and 1 × 10⁶ FAP-12 CAR-T cells on Day 3 (N = 3 mice per group). A total of 2.0 × 10⁶ UTD served as a negative control. (I) Tumor xenografts were monitored via bioluminescence imaging. Representative bioluminescence images of three independent experiments in each group of mice were shown. (J) Bioluminescence kinetics of the tumor growth in the model. (K) Kaplan–Meier survival curve. p-values of log-rank tests were as follows: p = 0.0246 (Nectin4-7.19+FAP-12 vs. UTD); p = 0.0246 (Nectin4-7.19+FAP-12 vs. FAP-12); p = 0.1161 (Nectin4-7.19+FAP-12 vs. Nectin4-7.19), N = 3. (L) Body weight of mice since the tumor inoculation. Data represent the mean ± SD; *p < 0.05, **p < 0.01, ***p < 0.001, t-test.

