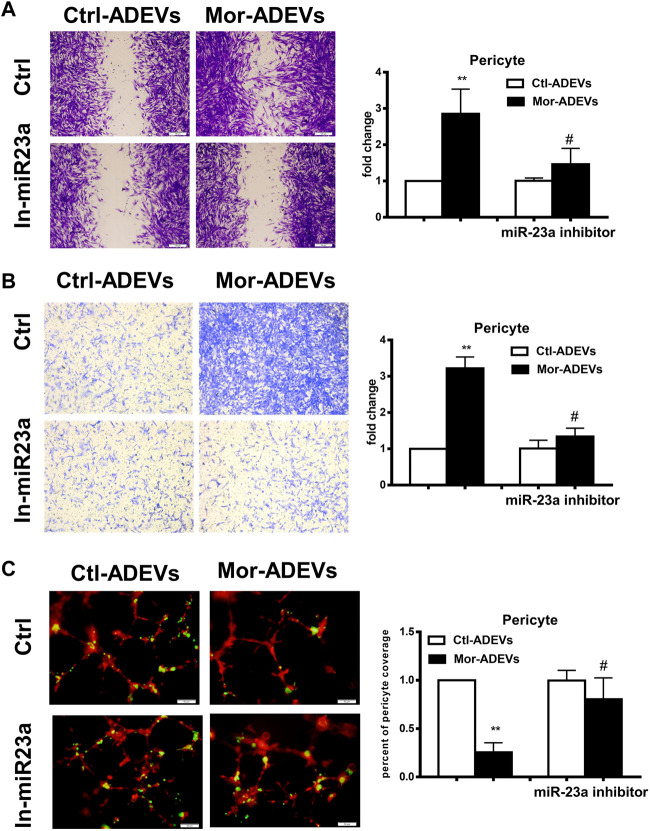
FIGURE 4.
Morphine-ADVE-miR-23a induces pericyte migration. (A) The migration of pericytes was measured by the scratch migration assay. The representative images of pericytes were stained with crystal violet and then analyzed by ImageJ software. Scale bars, 100 μm. (B) The migration of pericytes was measured by the transwell migration assay. The representative images of migratory pericytes were stained by crystal violet and then analyzed by ImageJ software. Scale bar = 100 µm. (C) Loss of pericytes was measured by the 3D pericyte (green)-endothelia (Red) coculture model, and the representative images were analyzed by ImageJ. Scale bars, 50 μm. All data are presented as mean ± SD, **p < 0.01 vs. control group, #p < 0.05 vs. morphine-ADEVs + miR-23a inhibitor group using one-way ANOVA analysis.

