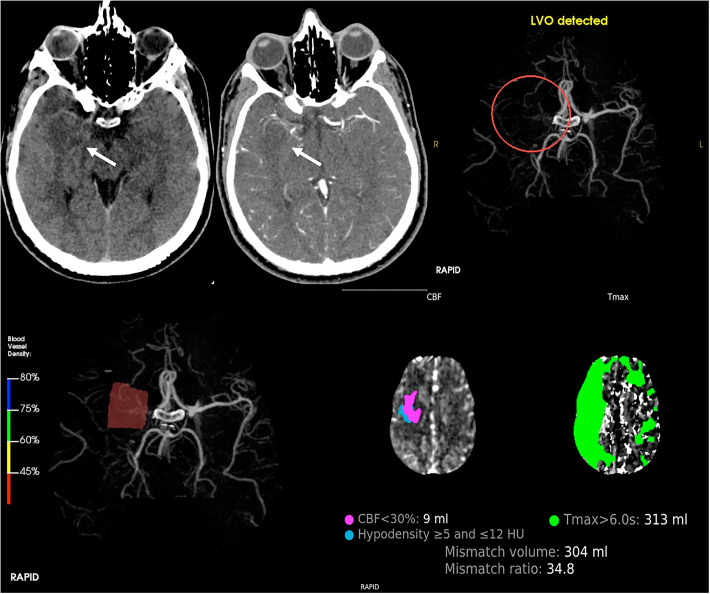
Fig. 1.
Top, from left to right: CT axial sections without and with contrast enhancement depict a focal area of ipo-density correlated with ischemic site (white arrow) due to occlusion of right middle cerebral artery, confirmed with RAPID software – LVO detected (red circle). Bottom, from left to right: 3D CT angiography shows flow reduction with blood vessel density <45% in right M1; then, RAPID software calculates CBF and Tmax for depiction of mismatch volume and ratio. These evaluations are fundamental for our endovascular treatment planning. CBF, cerebral blood flow; CT, computed tomography; LVO, large vessel occlusion; M1, first tract of middle cerebral artery; Tmax, time-to-maximum.

