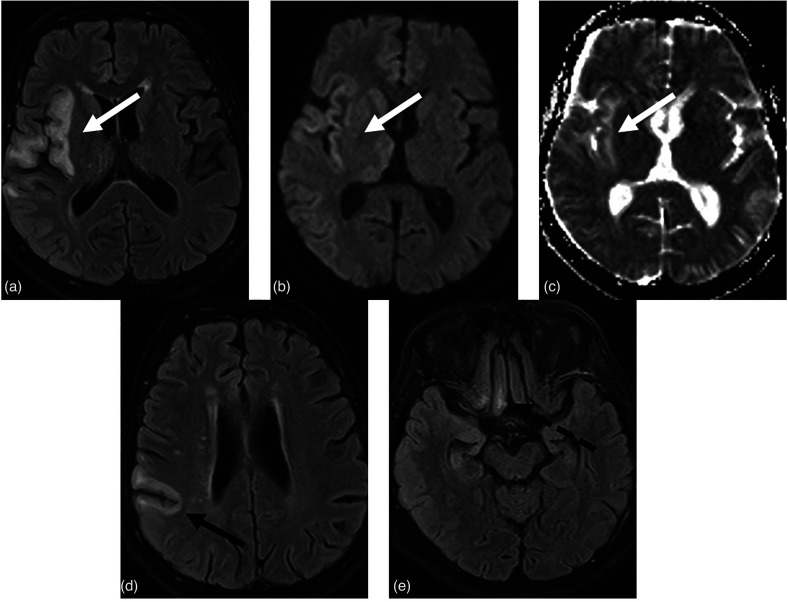
Fig. 3.
(a, b) MR-FLAIR sequences show a diffuse cortical-subcortical hyper-intensity signal in the right temporo-parietal insular region (white arrows) that correlates with diffusivity restriction in (c) the ADC map (white arrow). (d) Another area of similar meaning (encephalitis) is showed at the central cortex (black arrow). (e) At the same time, hyper-intensity in FLAIR images in the right rectal and orbital gyrus, near the olfactory groove (dotted black arrow). This patient manifests anosmia so we could think about an olfactory involvement. ADC, apparent diffusion coefficient; FLAIR, fluid-attenuated inversion recovery; MR, magnetic resonance.

