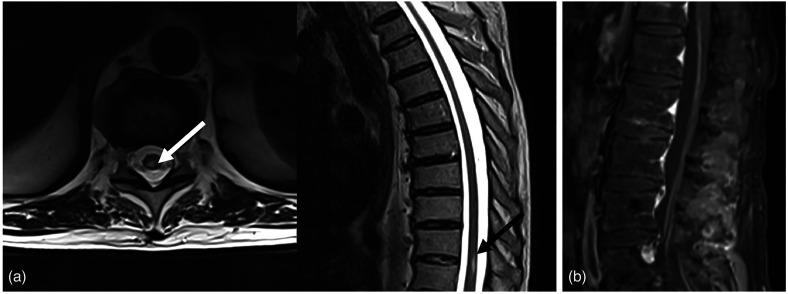
Fig. 4.
(a) MR T2-weighted sequences depict the myelitis process as an area of hyper-intensity that involved the right posterior portion of the spinal cord on the axial (white arrow) and sagittal (black arrow) planes at the D9-D10 level. (b) MR T1-weighted contrast enhancement sequence on the sagittal plane shows linear enhancement at cauda equina roots as a typical feature of Guillain–Barre syndrome.

