
Figure 1. Multiple oncogenic and inflammatory pathways upregulated in recurrent tumors converge on IL6.
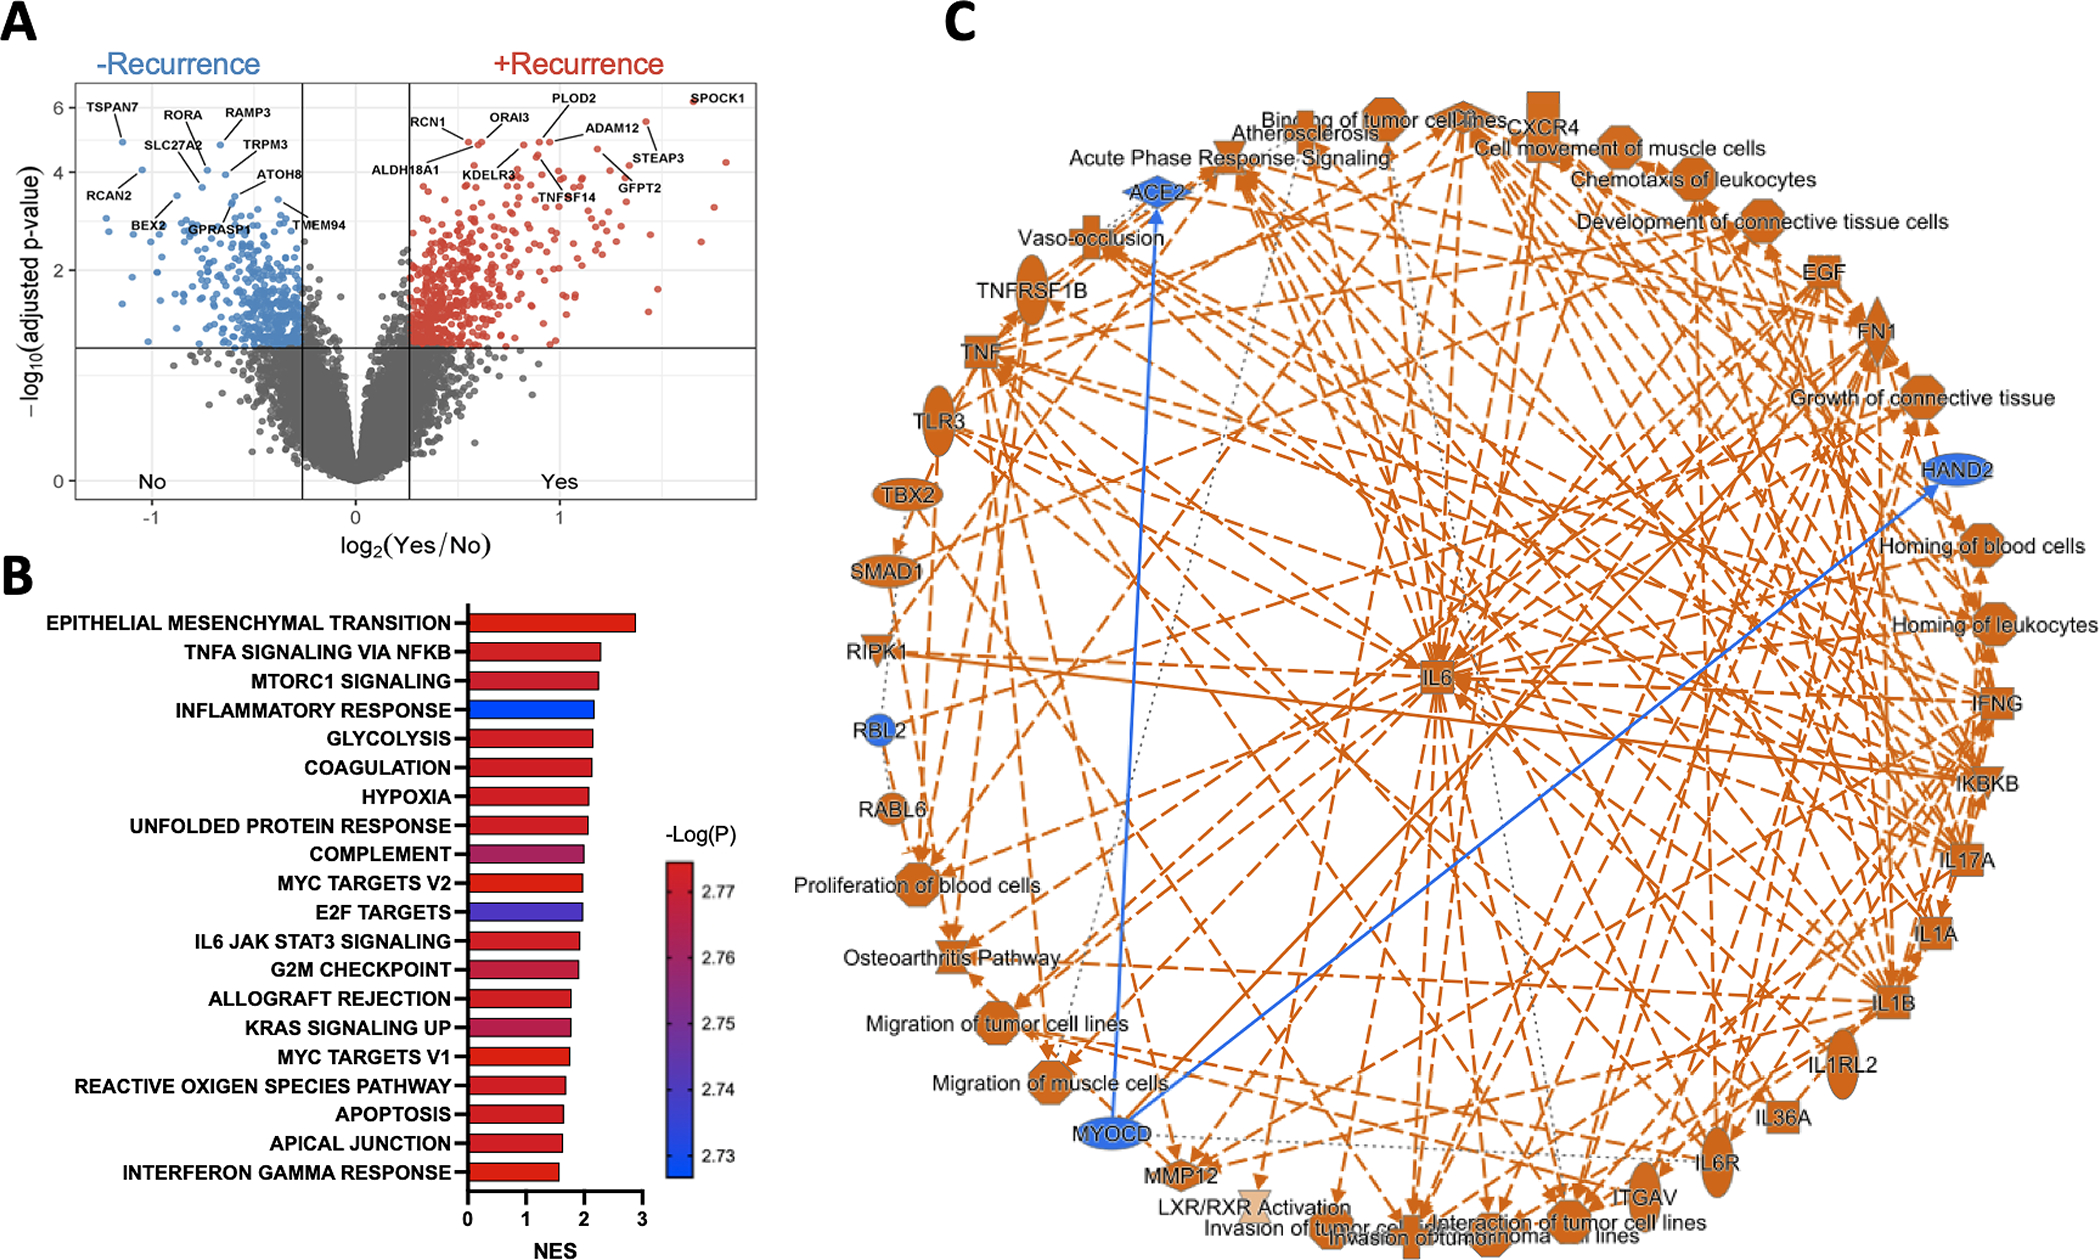
(A) Volcano plot demonstrating differentially expressed genes in recurrent vs non-recurrent tumors. (B) Bar graph displaying the top 20 GSEA analysis of hallmark gene sets, based on p-value, comparing recurrent vs non-recurrent tumors. Pathways are ranked by normalized enrichment scores (NES) and all shown pathways have adjusted p<0.05. (C) IPA graphical summary of core analysis highlighting IL6 as a common component among upregulated pathways in recurrent tumors.