
Figure 3. Lymphoid inflammation is not associated with disease recurrence.
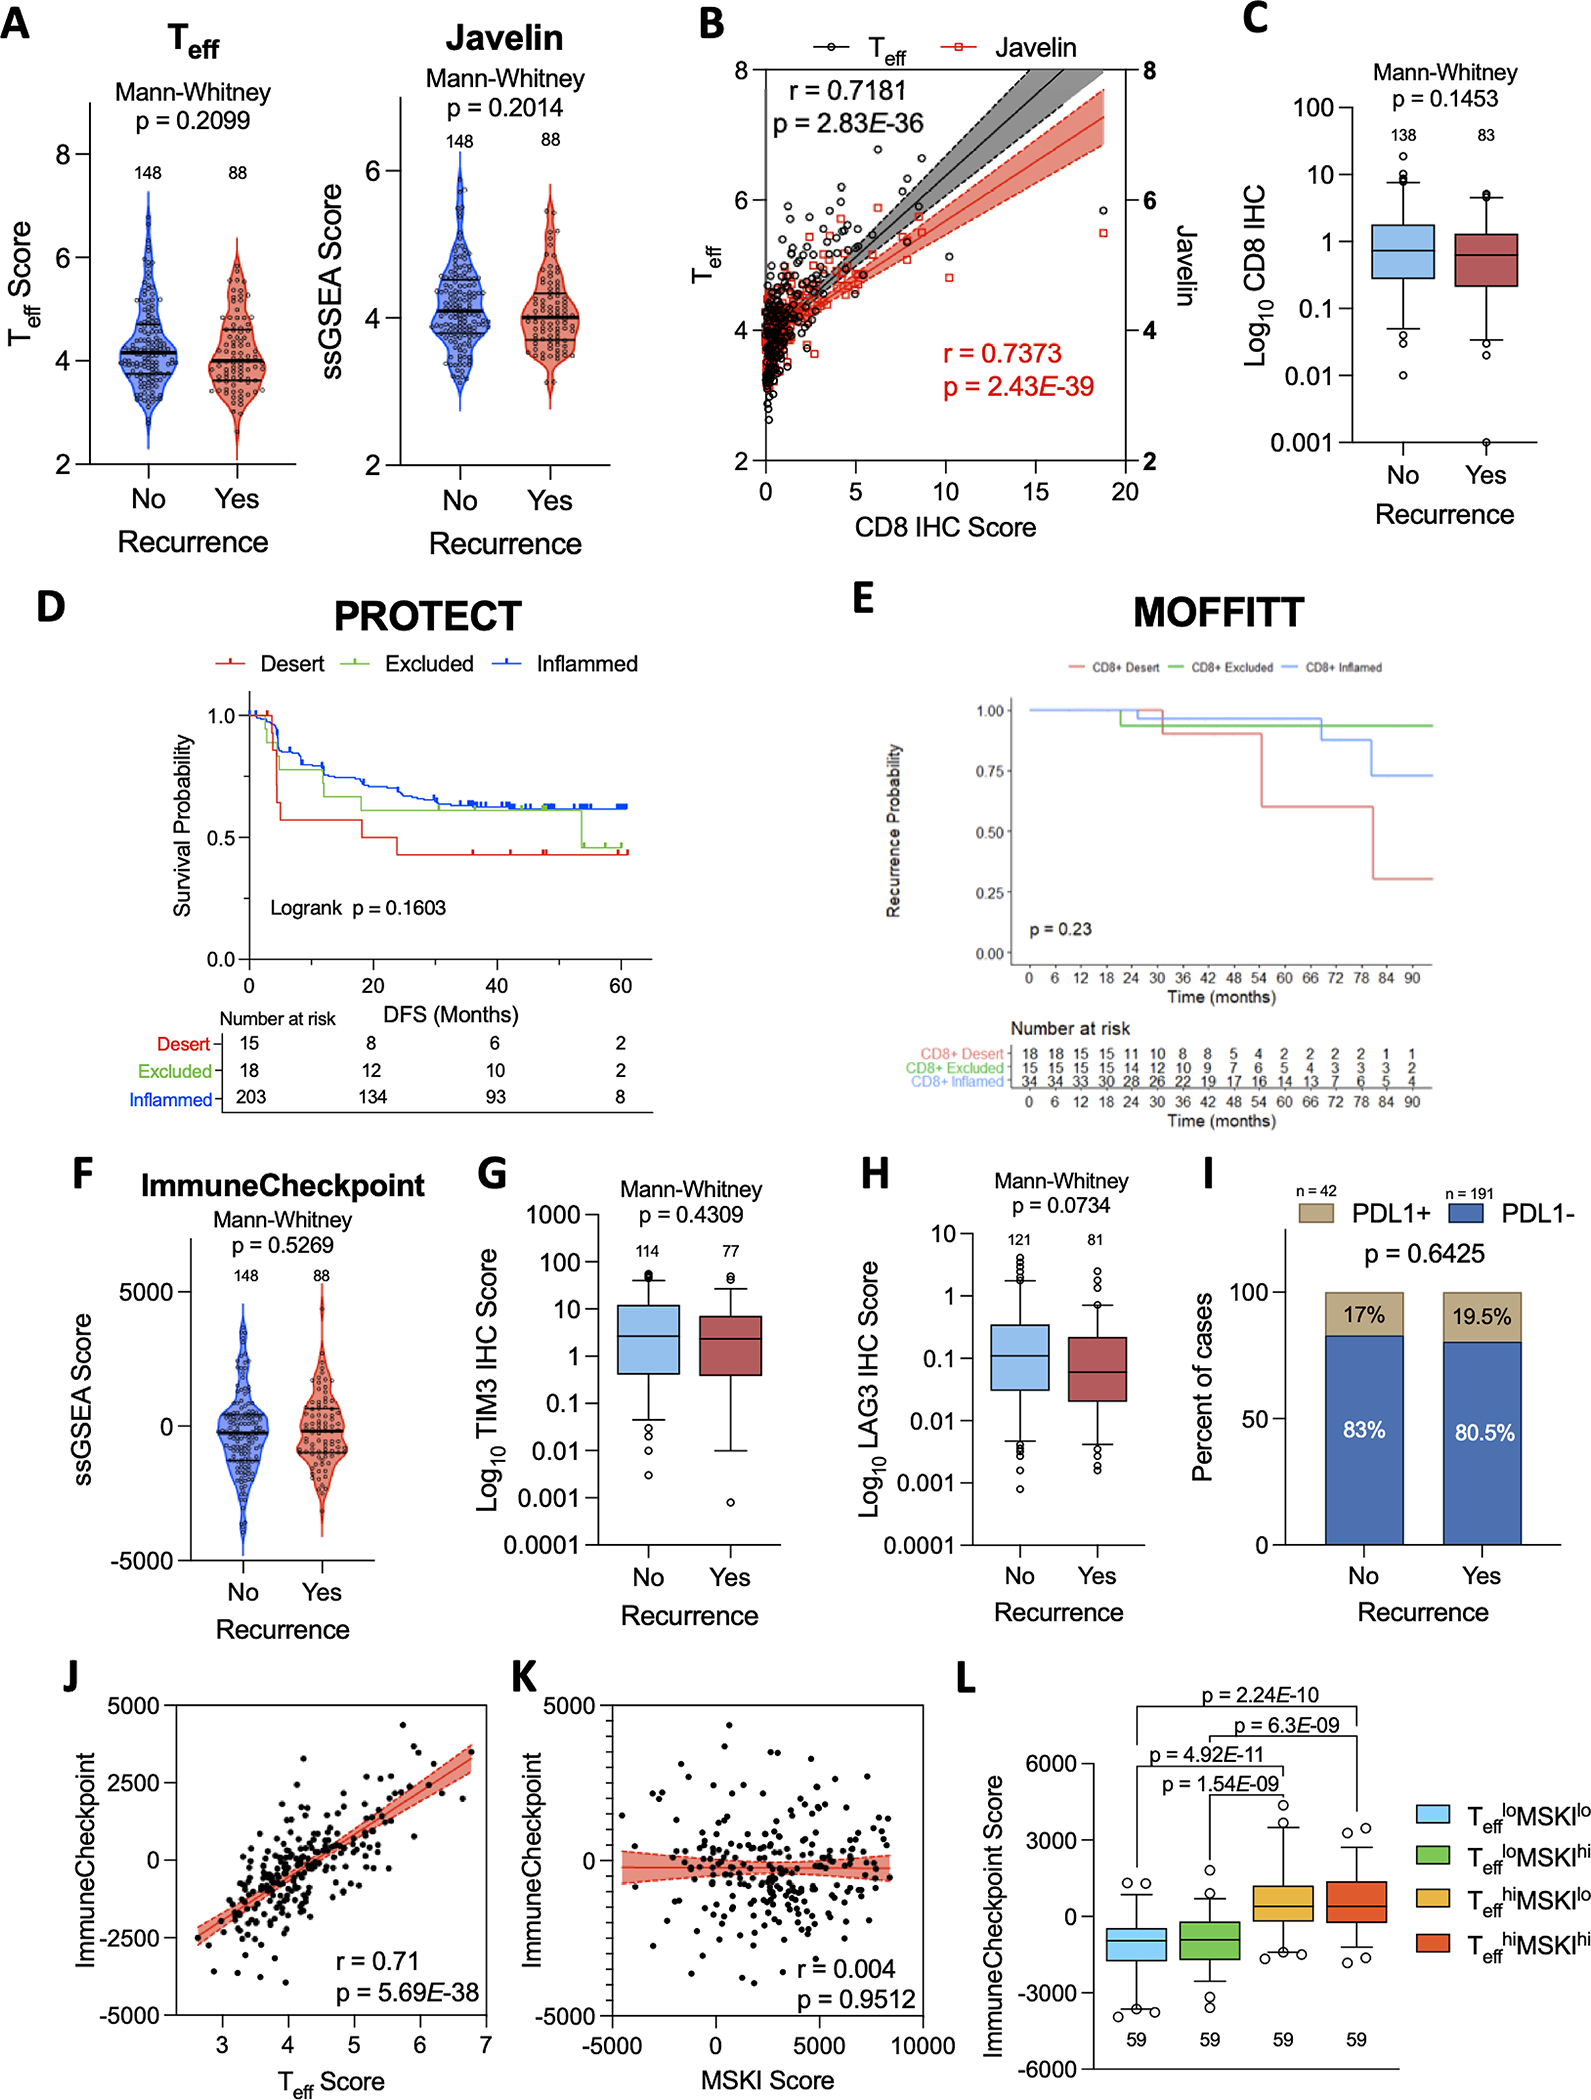
Violin plots of enrichment scores for (A) Effector T cell (Teff) and (B) Javelin gene scores in recurrent vs non-recurrent tumors. (B) Scatterplot showing relationship between CD8 IHC scores and Teff or Javelin signature scores. Spearman correlation coefficients with p-values obtained from two-sided tests shown. Shaded areas represent 95% confidence intervals. (C) Overall intratumoral CD8 IHC scores in recurrent vs non-recurrent tumors. (D,E) Kaplan-Meier analysis of CD8 infiltration patterns on DFS in the (D) PROTECT and (E) MOFFITT cohorts. (F,G) Violin plots of enrichment scores for (F) ImmuneCheckpoint GES in recurrent vs non-recurrent tumors. (G,H,I) IHC scores for (G) TIM3, (H) LAG3, and (I) PD-L1 in recurrent vs non-recurrent tumors. PD-L1 positivity defined as >1% tumor cells labeled. (J,K) Scatterplots showing correlation between the ImmuneCheckpoint score and (J) Teff score and (K) MSKI GES. (L) Box plots demonstrating difference in median ImmuneCheckpoint score and Teff high vs low (Teffhi vs Tefflo) and MSKI high vs low (MSKIhi vs MSKIlo) groups.