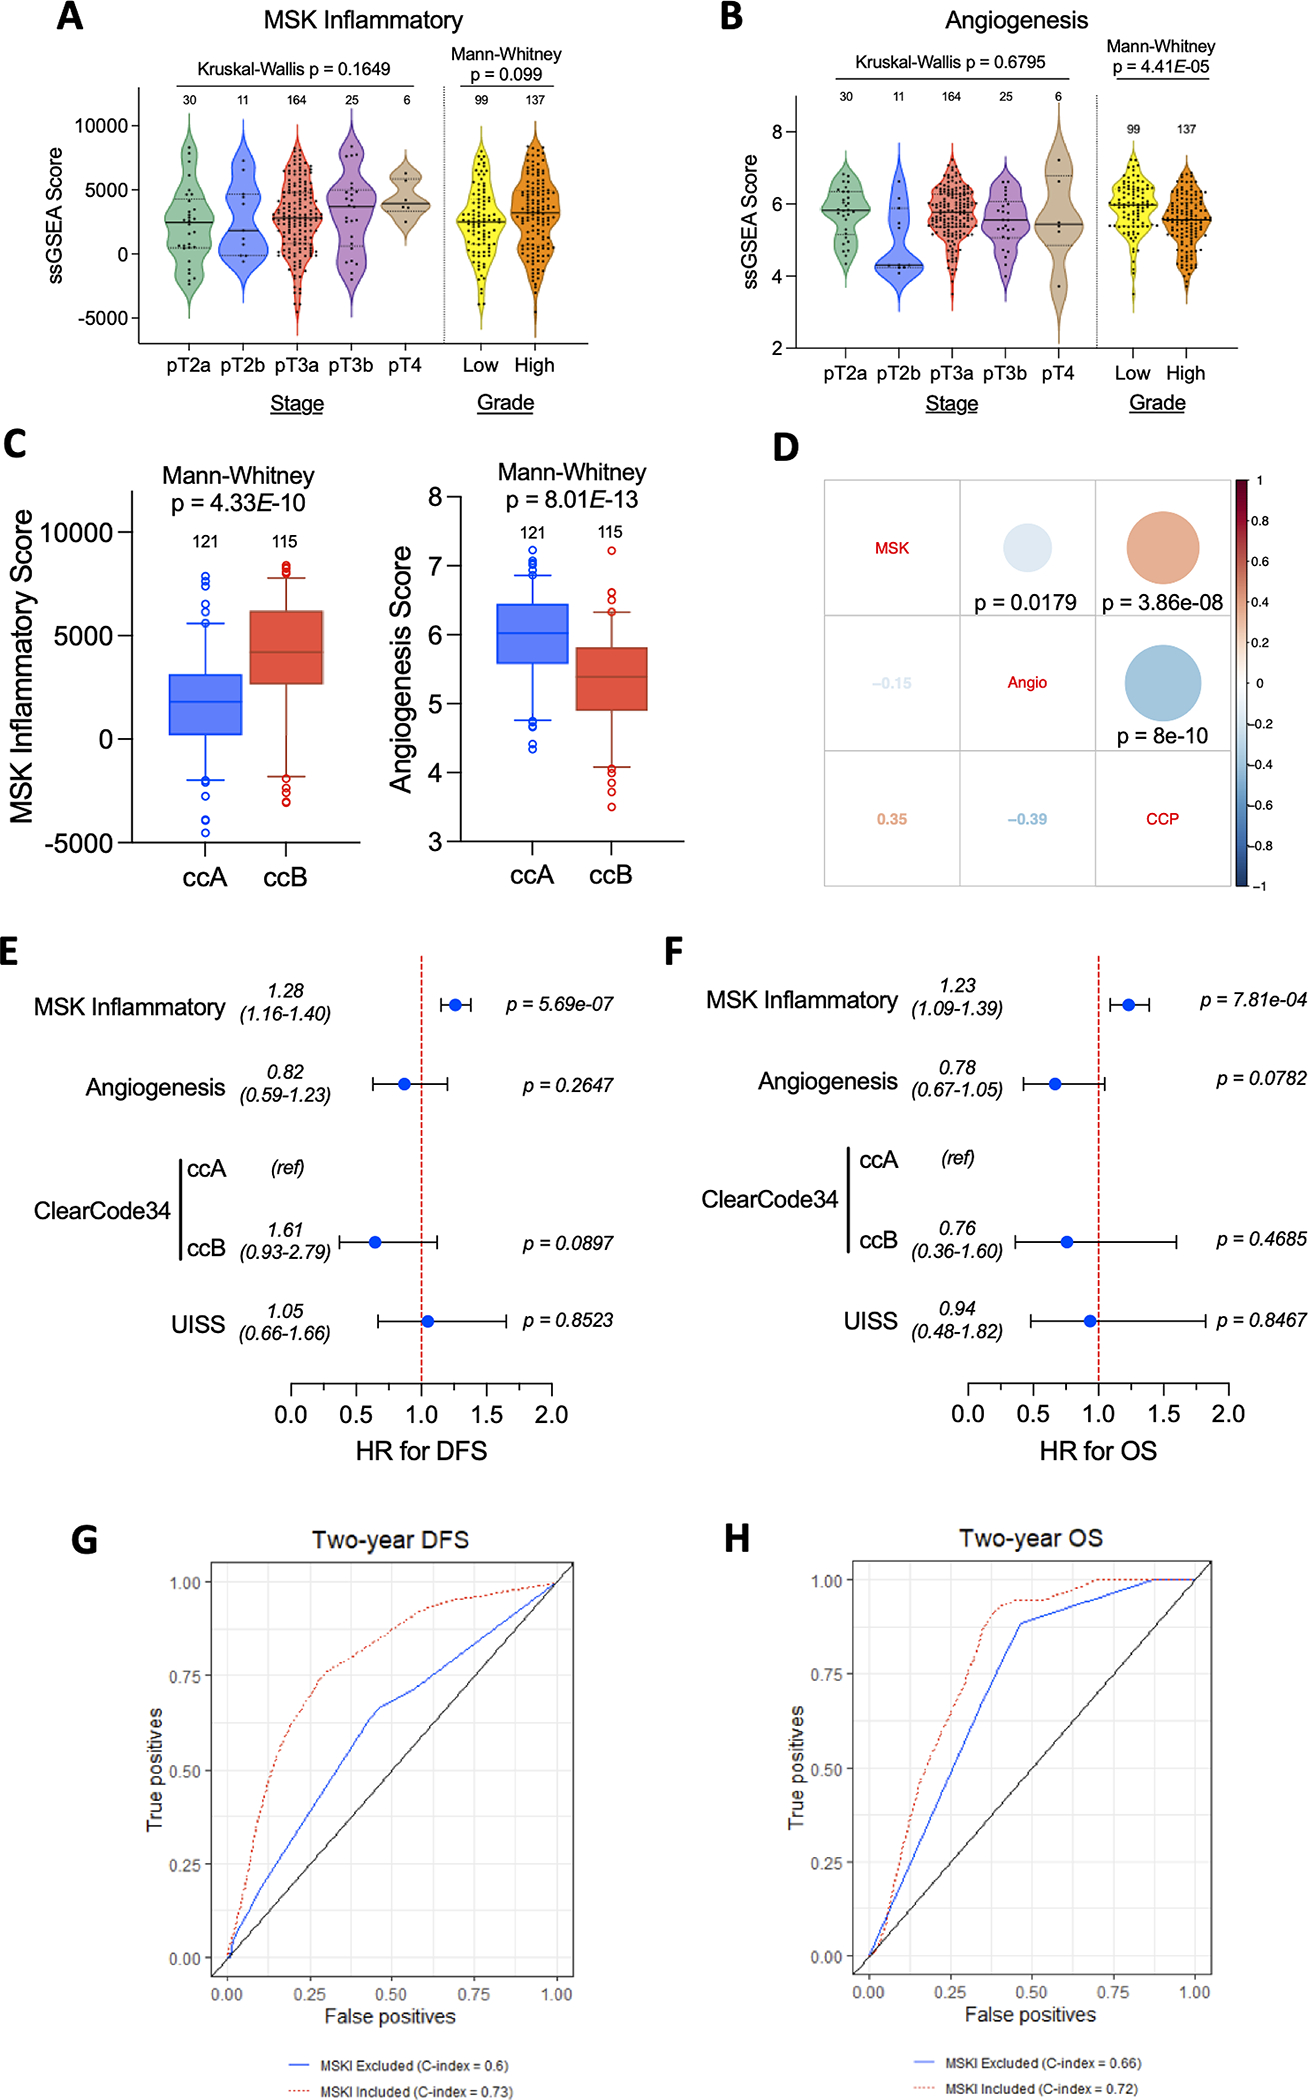
Figure 4. Univariate and multivariate analysis of relationships between TME gene signatures, previously validated risk models, and disease outcomes.

(A,B) Violin plots of (A) MSK inflammatory and (B) Angiogenesis score by tumor stage and grade. (C) Box plots of MSK Inflammatory and Angiogenesis score by ClearCode34 groups. (D) Correlation matrix displaying Spearman correlation coefficients (actual values in lower left-hand corner) with p-values obtained from two sided tests. (E,F) Forest plots displaying results of multivariate Cox regression for the listed variables with respect to (E) DFS and (F) OS. Two-year timepoint receiving operating characteristic (ROC) curves and c-indices to for both (G) DFS and (H) OS multivariable models. The DFS full model includes MSKI, ClearCode34, and UISS. The OS full model includes MSKI, CCP, and UISS.
