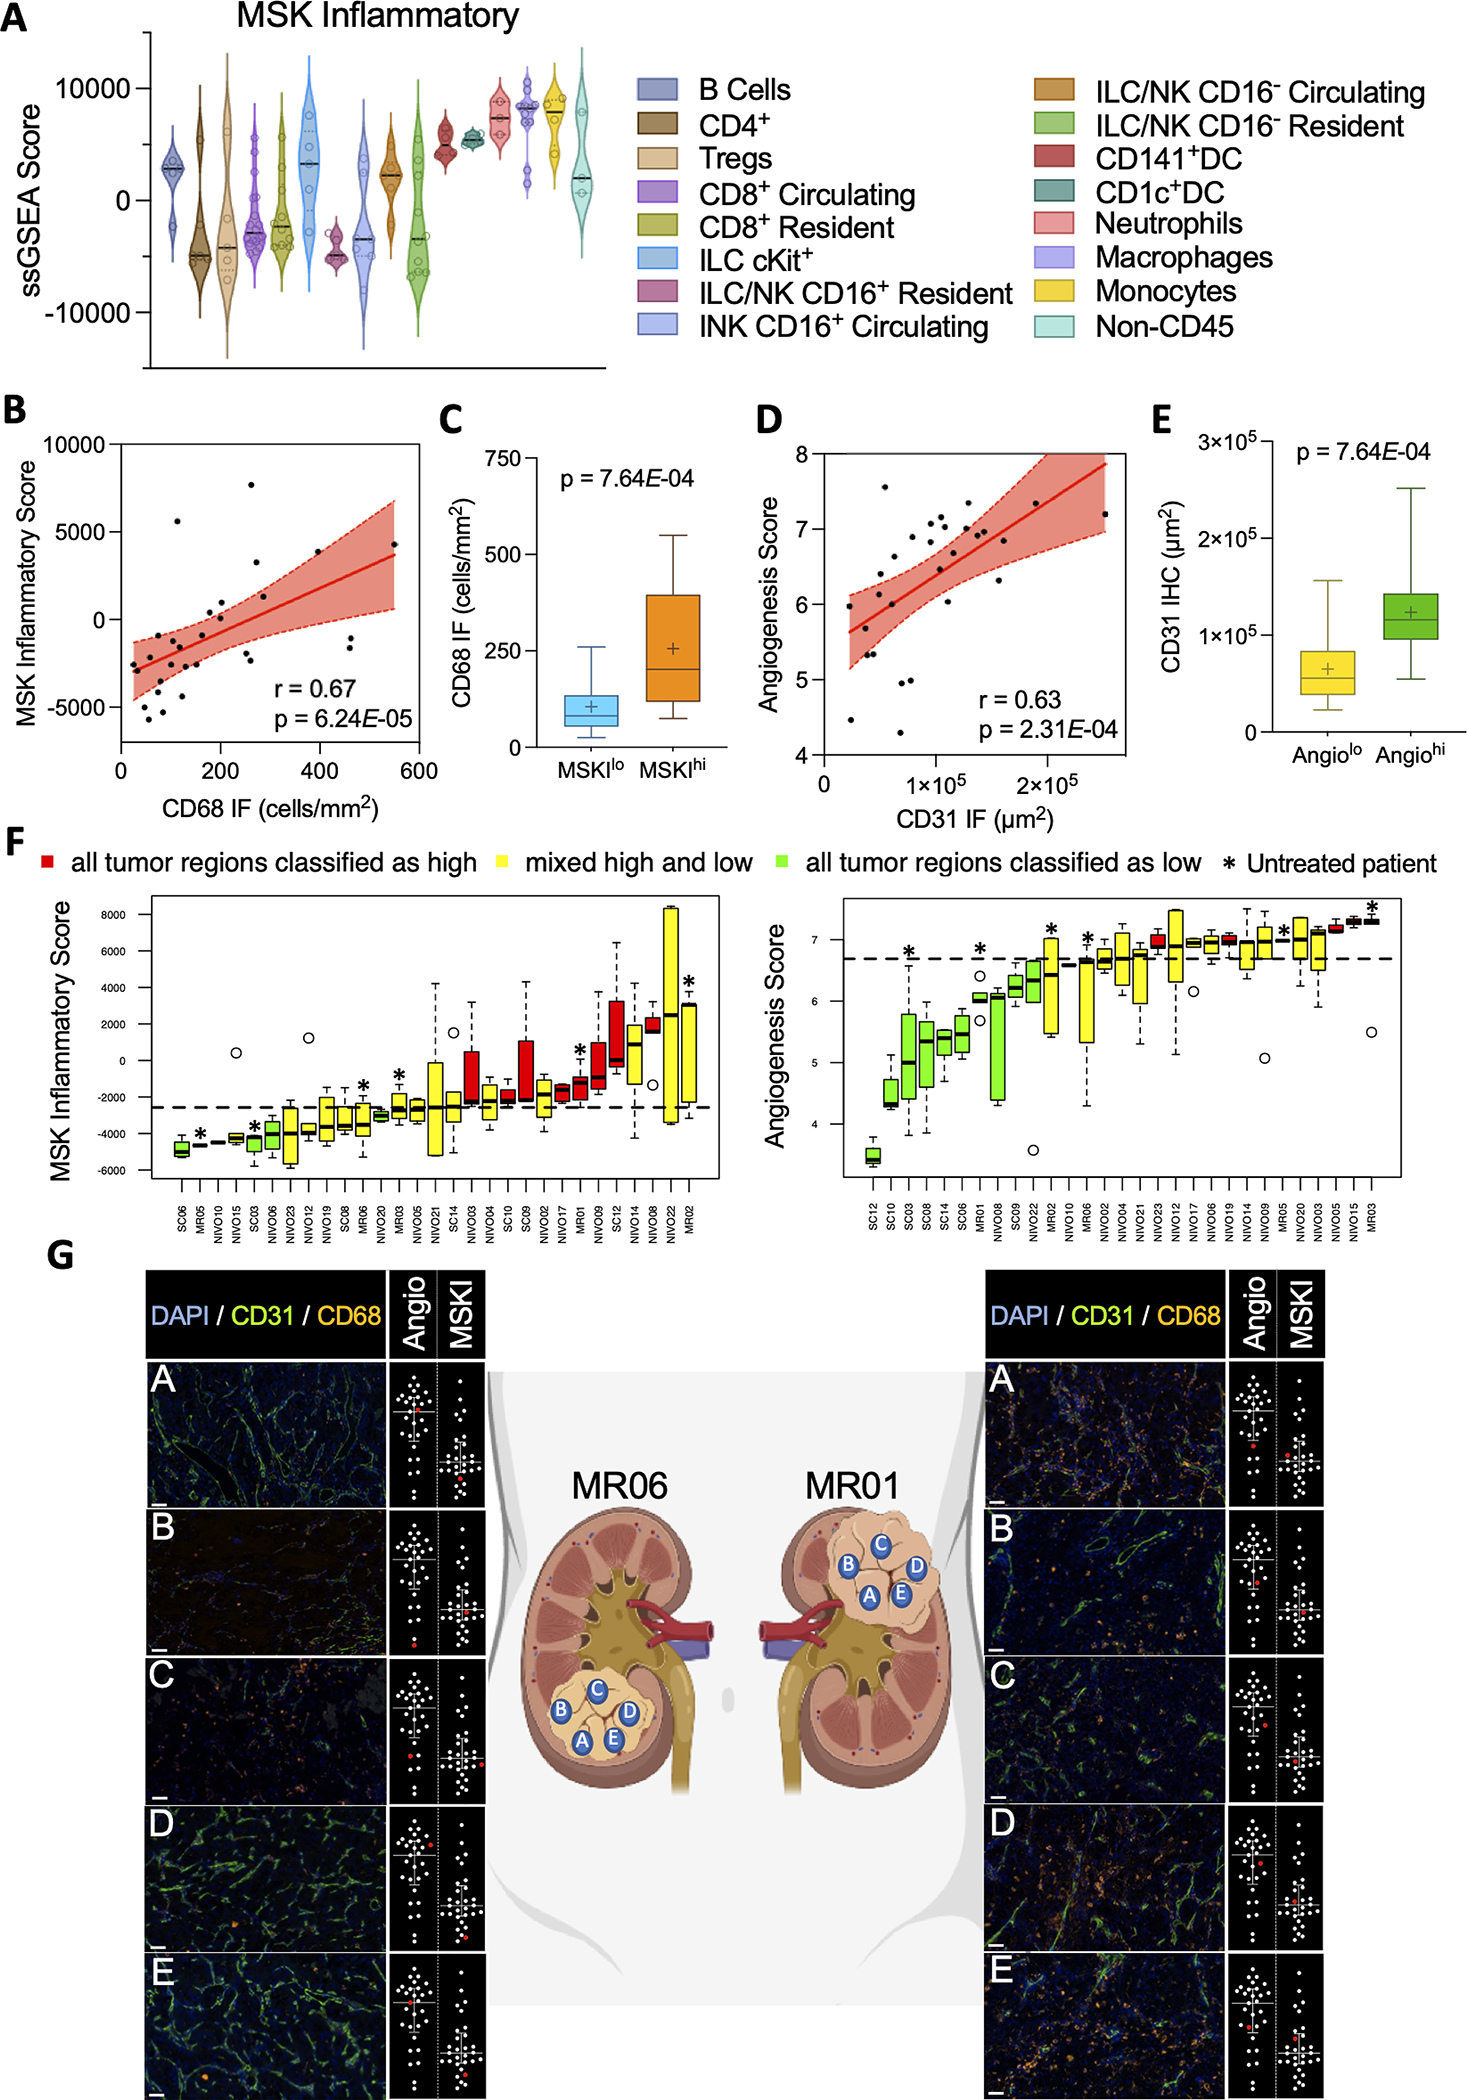
Figure 5. Intratumoral heterogeneity and cell populations underlying the MSK Inflammatory signature.

(A) Violin plots of MSK Inflammatory signature scores from fluorescence-activated cell sorted immune cell populations from ccRCC tumors. (B) Scatterplot showing correlations between MSK Inflammatory score and CD68 IF cell counts. Shaded areas represent 95% confidence intervals. (C) Box plots of CD68 IF cell counts in MSK Inflammatory high (MSKhi) vs MSK Inflammatory low (MSKIlo) tumors (based on median score) (D) Scatterplot showing correlations between Angiogenesis score and CD31 IF area derived from paired ccRCC tumor samples. Shaded areas represent 95% confidence intervals. (E) Box plots of CD31 IF areas in angiogenesis high (Angiohi) vs angiogenesis low (Angiolo) tumors (based on median score). (F) Box plots of MSK Inflammatory and angiogenesis score from multiregional tumor samples (n = 2–7 regions per tumor from total 29 patients). Each bar represents one individual patient. Dotted line represents the median enrichment score (G) Representative IF images corresponding to signature score dot plot (highlighted in red in inset) demonstrating intratumoral heterogeneity from two multiregional tumor samples. Scale bar = 50 μm
