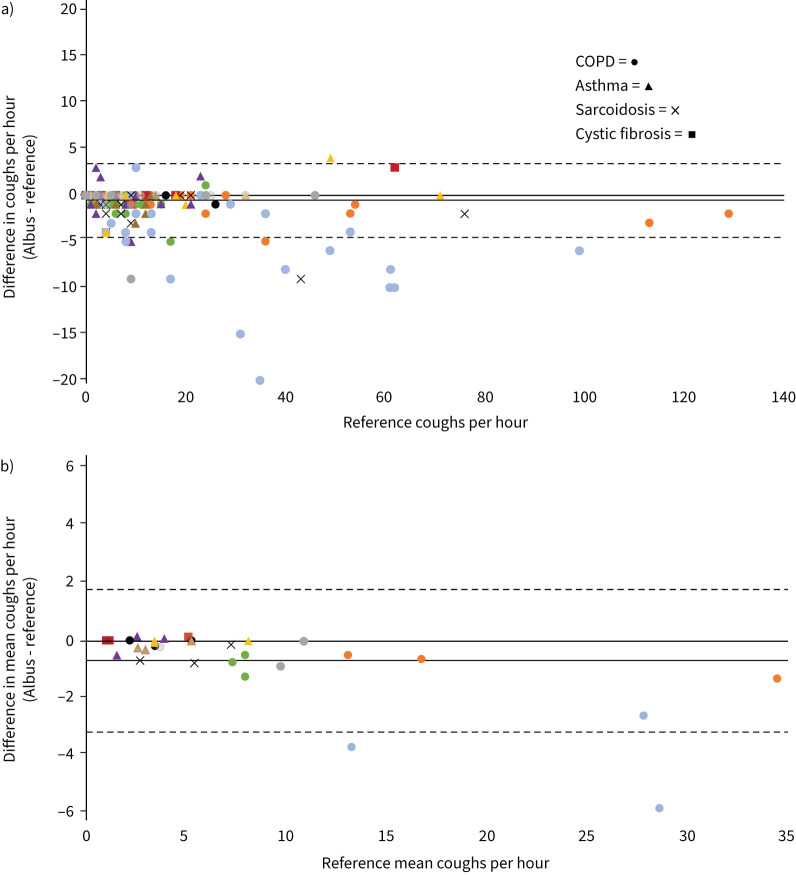
FIGURE 2.
Bland–Altman plots showing agreement in cough counts between Albus system and human reference counts. Solid lines show mean difference. Dotted lines show 95% limits of agreement (1.96 × sd). Data points are shown as different shapes for each condition (as per key) and in different colours for each subject. a) Comparison of hourly cough counts for each hour of validation set (n=375; multiple hours may overlap in count and difference). Mean difference: −0.6±2.0 coughs·h−1. b) Comparison of mean hourly cough counts for each night of validation set (n=30; three nights each for 10 subjects). Mean difference: −0.7±1.3 coughs·h−1.

