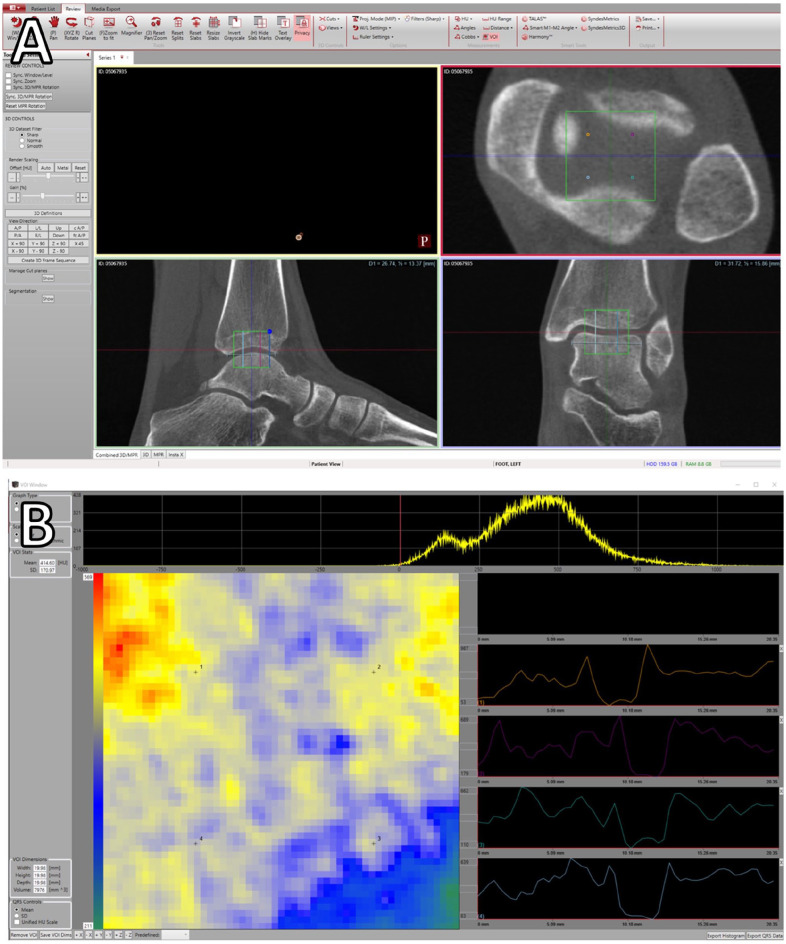
Figure 2.
(A) CubeVue window showing the volume of interest (VOI; green square) centered at the tibiotalar joint space, and the 4 selected projections (orange, magenta, cyan, and blue lines) for the control. (B) Second CubeVue window demonstrating the VOI tool interface. Left: a heatmap of mean intensity within the axial plane; right: Hounsfield unit plots perpendicular to the axial plane for the 4 selected projections; top: histogram of the voxels in the VOI (top).

