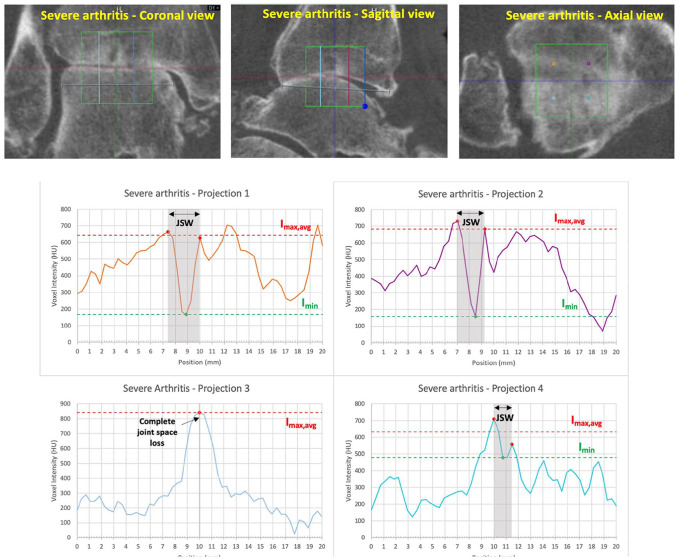
Figure 7.
Severely arthritic ankle computed tomographic (CT) images in the coronal, sagittal, and axial views, and graphical plots for all 4 projections. JSW, Imax,avg, and Imin are shown on each plot where applicable. Colors of the plots correspond to the color of the projection in the CT images. Note that projections 1, 2, and 4 demonstrate joint space width narrowing and that projection 3 shows complete joint space loss. Projection 4 also shows significant reduction in contrast (Imax,avg, and Imin are closer together).

