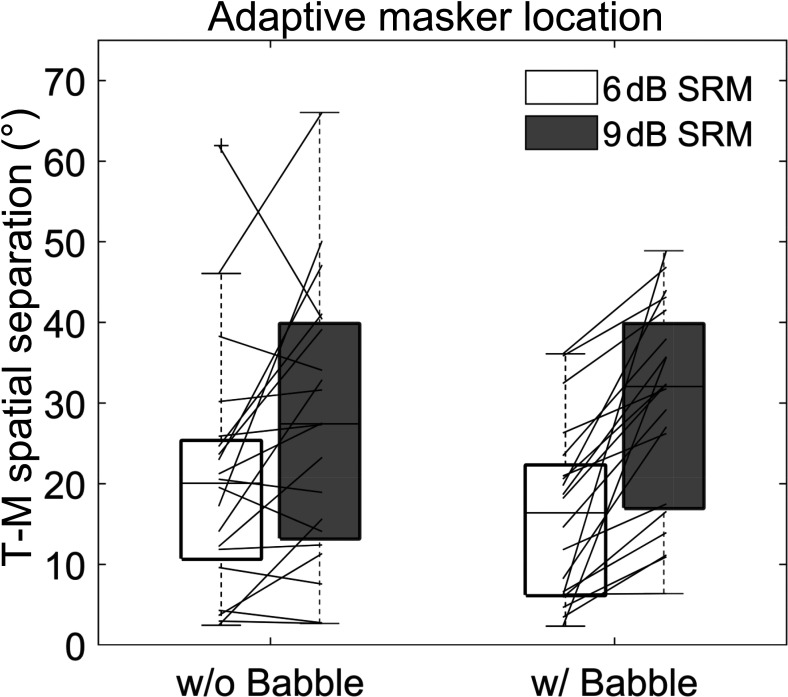
Fig. 2.
Individual spatial boundary thresholds for 6 dB (white) and 9 dB (gray) release from masking without babble (left) or with babble (right) present. Boxplots show median as a horizontal line, whiskers extend from the extreme individual points between 25th and 75th percentile, and crosses indicate outliers (created using boxplot2) (Kearney, 2022).

