Fig. 2.
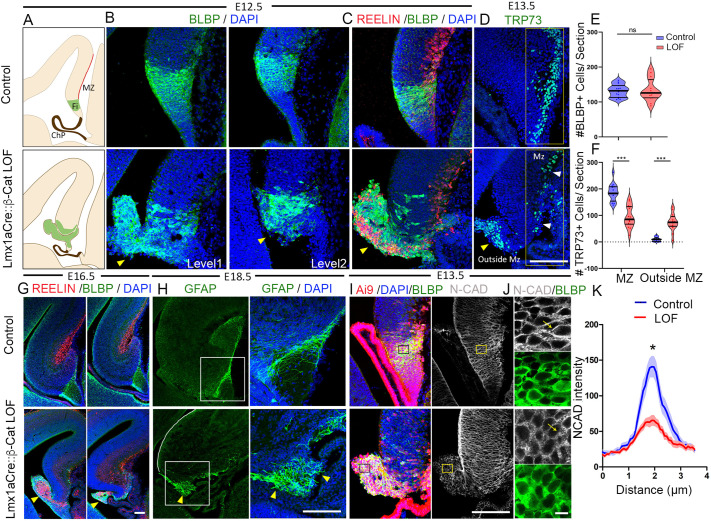
Loss of β-catenin in the cortical hem causes disrupted assembly of the fimbrial scaffold and mispositioning of the CR cells. (A) Cartoons of E12.5 sections indicating the marginal zone (red line; MZ) and the fimbrial progenitors residing in the hem (green; Fi). ChP, choroid plexus. (B) BLBP immunostaining at two levels of sectioning reveals the disorganization of fimbrial scaffold and an ectopic glial protrusion (yellow arrowhead) in Lmx1aCre::β-catenin LOF brains in comparison with controls. Representative images are shown of sections taken from n=5 brains (biologically independent replicates) examined over five independent experiments. (C) Co-immunolabeling for reelin and BLBP reveals the mispositioning of CR cells in the ectopic glial protrusion (yellow arrowhead); representative images are shown of sections taken from N=3 brains (biologically independent replicates) examined over two independent experiments. (D) At E13.5, hem-derived TRP73+ CR cells are normally localized to the MZ (white arrowheads), but this population is significantly decreased in Lmx1aCre::β-catenin LOF brains and, instead, the cells are mislocalized in the ectopic glial protrusion (yellow arrowhead). (E) Quantification of BLBP+ cells shown in B reveals no significant difference in total BLBP+ cell number. (F) Quantification of TRP73+ cells shown in D indicates that 95% of the CR cells are localized in the MZ region in control brains, whereas only 56% are localized in the MZ in Lmx1aCre::β-catenin LOF brains and 44% are found outside the MZ region. N=5 brains (biologically independent replicates) examined over four independent experiments. (G) Co-immunolabeling with BLBP and reelin reveals the defective fimbrial scaffold in Lmx1aCre::β-catenin LOF brains at E16.5. (H) GFAP labeling at E18.5 reveals a well-ordered fimbrial scaffold in controls, but a disorganized scaffold in the Lmx1aCre::β-catenin LOF brains. Yellow arrowheads show the disorganized fimbrial scaffold. (I) Fimbrial scaffold cells identified by BLBP immunolabeling also display N-cadherin. (J) Magnification of the boxed region in I. (K) Quantification of N-cadherin across cell junctions along the yellow arrow in J. n=30 cells from N=3 brains (biologically independent replicates) examined over three independent experiments. Two-tailed unpaired Mann–Whitney U-test; *P<0.05, ***P<0.001; ns, P>0.05 (E: P=0.9268; F: P=0.007937; K: P=0.0150). Scale bars: 10 μm (J); 100 μm (B-D,G-I).

