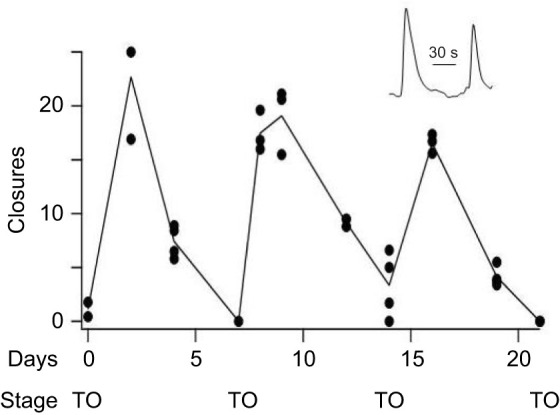
Fig. 3.

Spontaneous siphon closure follows the rhythm of brain maturation and degeneration. ROIs corresponding to the oral siphon were assigned to all six zooids in the same module. An example of two successive siphon closures is shown in the insert (closures are upward deflections). The number of siphon closures was counted in each zooid during 15 min video recording sessions spread over 21 days. Data were collected between the hours of 11:00 and 14:00 h every 2 to 3 days. The sum of closures in all the zooids is plotted in the graph (circles). In most cases two or more repeat measurements were made, separated by 20 min intervals. The line connects the means of repeat measurements. Between experiments the bathing medium was refreshed and the colony was returned to the incubator. There was no other stimulation. The video rate was 12 frames s−1 and siphon closures were scored if the reflected light intensity during the movement changed by >5%. The state of zooid development was determined from inspection of photomicrographs and the time of takeover (TO) is noted on the graph.
